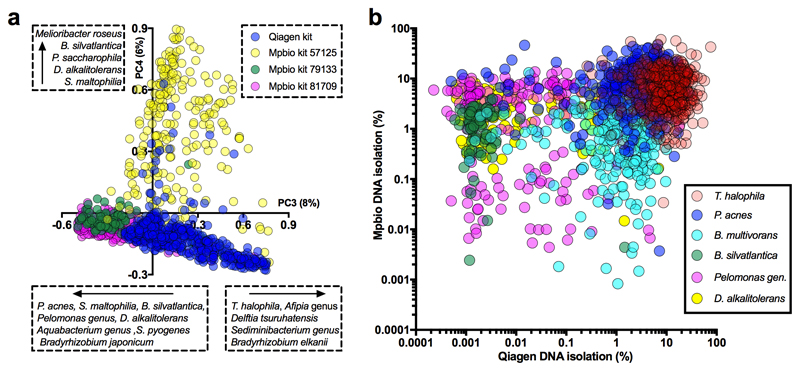
Extended Data Fig. 5. Species associated with batch effects visualized by PCA also do not show signal reproducibility.
a) Principal component analyses of selections of samples from Cohort 2 (16S), or of all Cohort 2 samples as shown here, allows for the identification of batch effects and allows for the identification of contaminating species associated with the use of specific DNA isolation methods/kits and/or other reagents. An analysis of all samples shows that principal components 3 (x-axis) and 4 (y-axis) are strongly correlated with the use of Qiagen or specific Mpbio DNA isolation kits. b) Examples of bacteria detected in high abundance and frequency when processed with the Qiagen (x-axis) and/or Mpbio (y-axis) DNA isolation kit. Patterns lacking positive correlation (compare with Fig. 2a) demonstrate that signals are not sample but batch associated.

