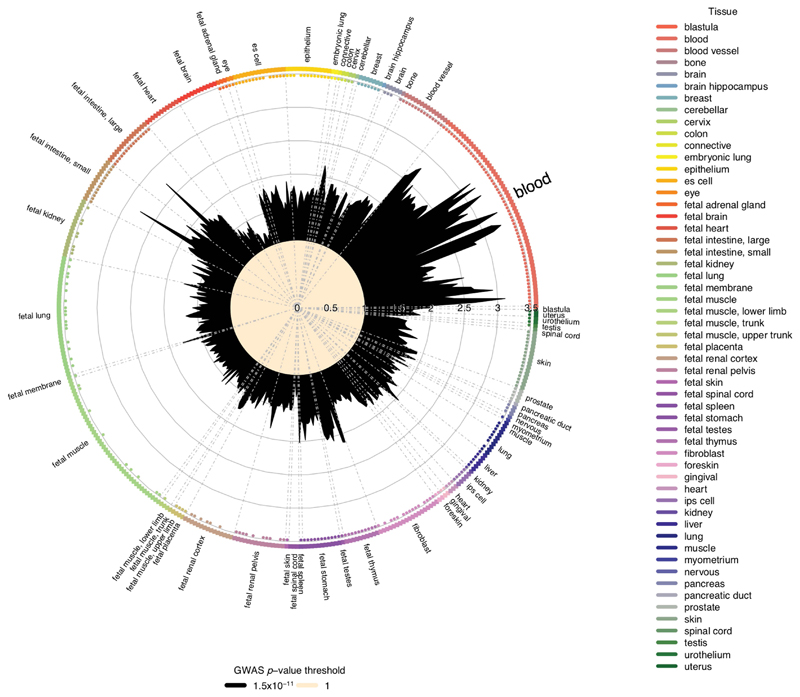
Extended Data Fig. 6. Enrichment of pQTLs at DNase I hypersensitive sites by tissue or cell type.
Circle shows enrichment for DNase I hypersensitive sites (‘hotspots’) for each of 55 tissues (183 cell types) available from the ENCODE and Roadmap Epigenomics projects, with tissues or cell types clustered and coloured by anatomical grouping. Some tissues have multiple values due to availability of multiple cell types or multiple tests per cell type. Radial lines show fold-enrichment, while dots around the inside edge of the circle denote statistically significant enrichment at a Bonferroni-corrected significant threshold P < 5 × 10⁻⁵. Enrichment testing performed using GARFIELD (which tests enrichment against permuted sets of variants matched for MAF, distance to TSS and LD). pQTL data from n = 3,301 individuals.

