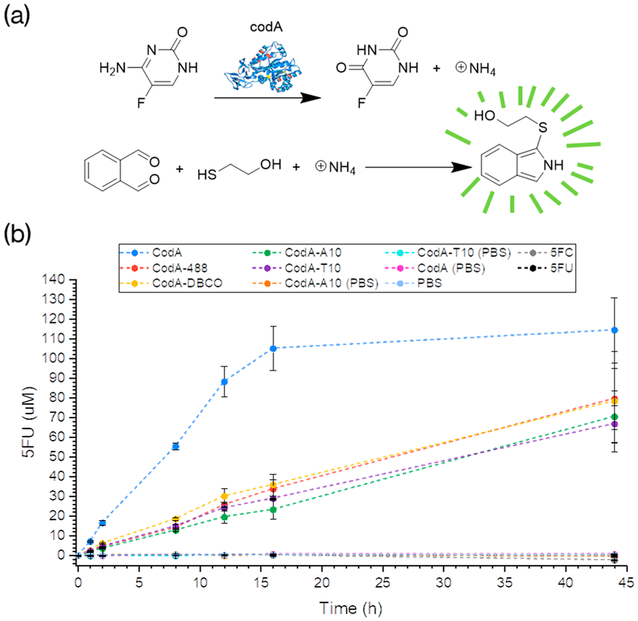
Figure 2.
(a) Scheme of the OPAME assay for determining 5-FC deamination rates. (b) Plots showing the amount of 5-FC converted to 5-FU over time as determined by the OPAME assay. Samples were run with using 500 μM 5-FC or 5-FU in the absence of the presence of 10 nM CodA. All reactions were run in triplicate with each point showing the average value obtained and subsequent error bars.

