
Figure 1.
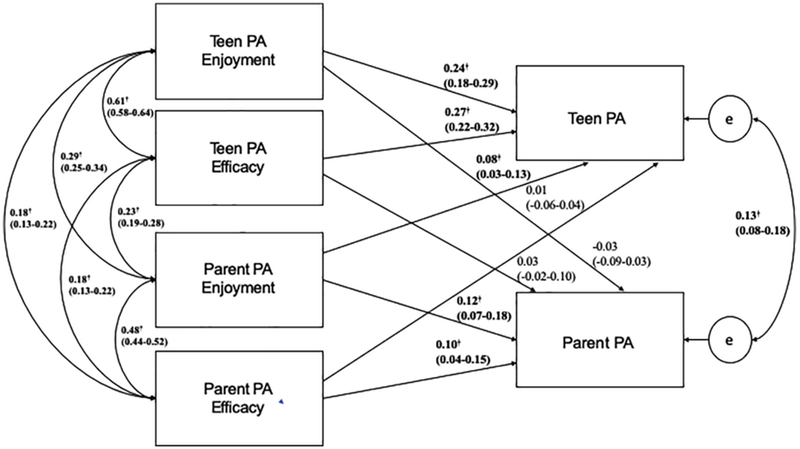
Schematic diagram showing the dyadic interrelationships among adolescent and parent enjoyment, efficacy, and weekly self-reported physical activity using the total sample.
Note: PA stands for physical activity; all coefficients are standardized with 95% Confidence Intervals; bold and † denotes significant path coefficients, p < 0.05; model adjusted for adolescent age.