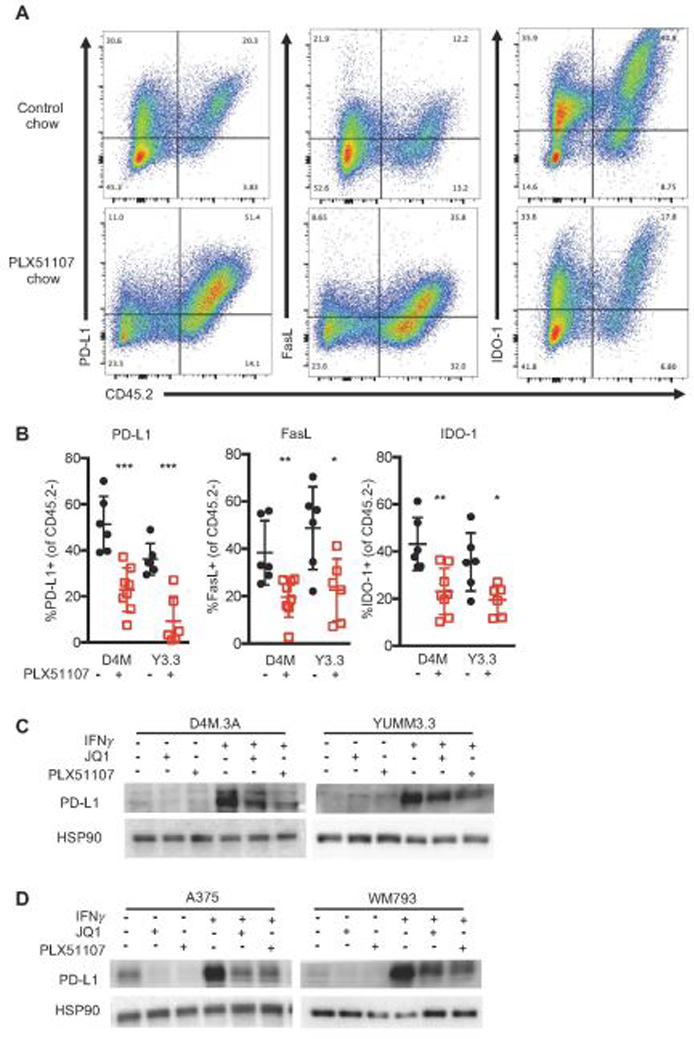
Figure 4. BETi alters the immunogenicity of BRAF V600E melanoma tumors.

A-B) Data were obtained from D4M3.A (D4M) or YUMM3.3 (Y3.3) tumors at sacrifice from mice in Fig. 1. Tumors were collected, made into single suspensions, and phenotyped using FACS analysis. A) Representative FACS plots of PD-L1, FasL, or IDO-1 expression by CD45.2+. B) Mean expression +/− SD of PD-L1, FasL, and IDO-1 on non-hemaetopoetic (CD45.2 negative) cells in tumors. Significance was assessed by unpaired t-test comparing BETi treatments compared to its relative control, *p<0.05, **p<0.01, ***p<0.001, ****p<0.0001. Mouse (C) and human (D) BRAF V600E melanoma cell lines (n=3 for all cells) were treated with 1 µM JQ1, 2 µM PLX51107, and/or 100 ng IFNγ treatment for 48 hours and analyzed for PD-L1 expression by Western blot. HSP90 serves as loading control.
