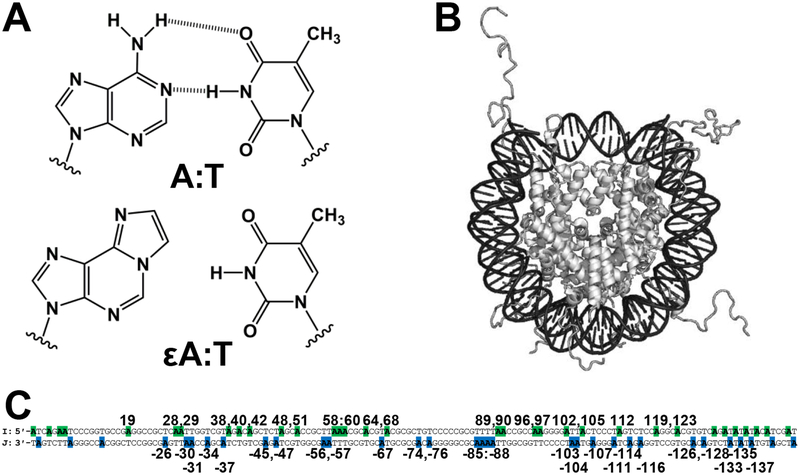
Figure 1.
Representations of lesions, NCP, and DNA sequence. (A) An A:T bp and mutagenic εA:T bp. (B) Representation of an NCP. (C) The 145 bp Widom 601 duplex. Locations of A in sequence are highlighted in the I strand (green) and J strand (blue). Base pairs are numbered starting from the 5ʹ-end of the I strand, with the J strand nucleobase indicated by a negative.

