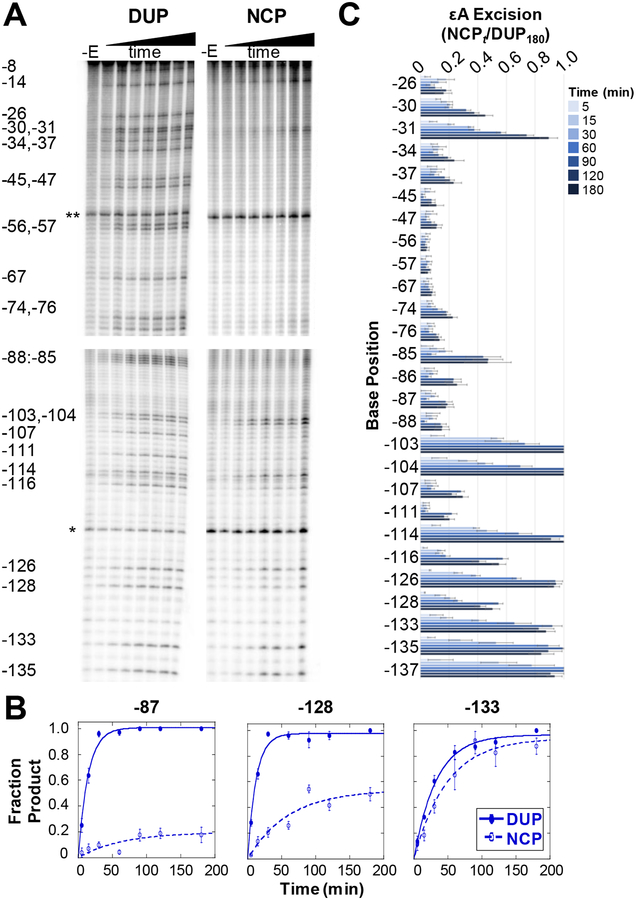
Figure 2.
Single-turnover kinetic time course experiments of εA excision by AAG. (A) Representative PAGE gels showing εA excision on the J strand of DUP (left) and NCP (right). DNA samples only treated with NaOH (-E lanes) show incidental damage from experimental conditions and sample workup. Two internal references, a 23 mer (*) and 92 mer (**), used for quantitation are indicated. Four separate gels are shown, indicated by the spaces between the images, with each gel cropped for alignment. The top two panels are aligned to show DUP and NCP data for positions −8 to −76. The bottom two panels are aligned to show data for positions −85 to −135. (B) Selected kinetic fits showing examples of low (site −87), medium (site −128), and high (position −133) amounts of εA excision on DUP (closed symbols) and NCPs (open symbols). (C) Quantitation of εA excision over time on the J strand in NCPs. Error bars are calculated standard errors (n= 3–10). Analogous data for the I strand in NCPs is shown in Figure S2.

