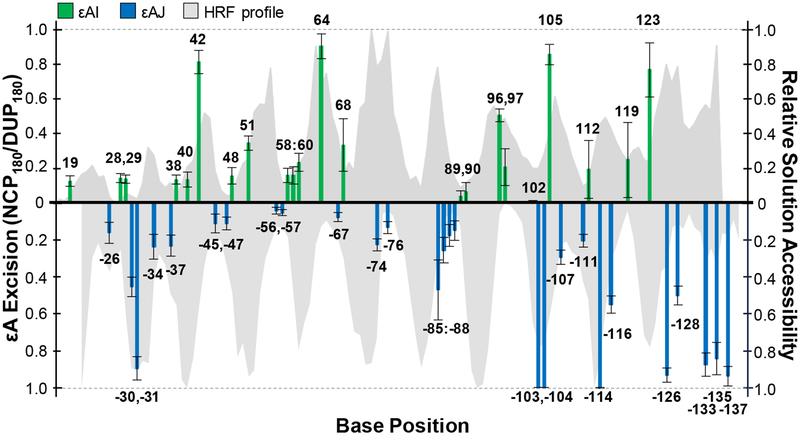
Figure 3.
Relationship between AAG activity on and solution accessibility of εA positions in the NCP. The amount of AAG excision after 180 min is shown as bars at each εA position along the I strand (green) and J strand (blue). Error bars represent the standard error (n = 3–10). The HRF profile characterizes relative reactivity as a function of base position and is depicted as gray area in the background.

