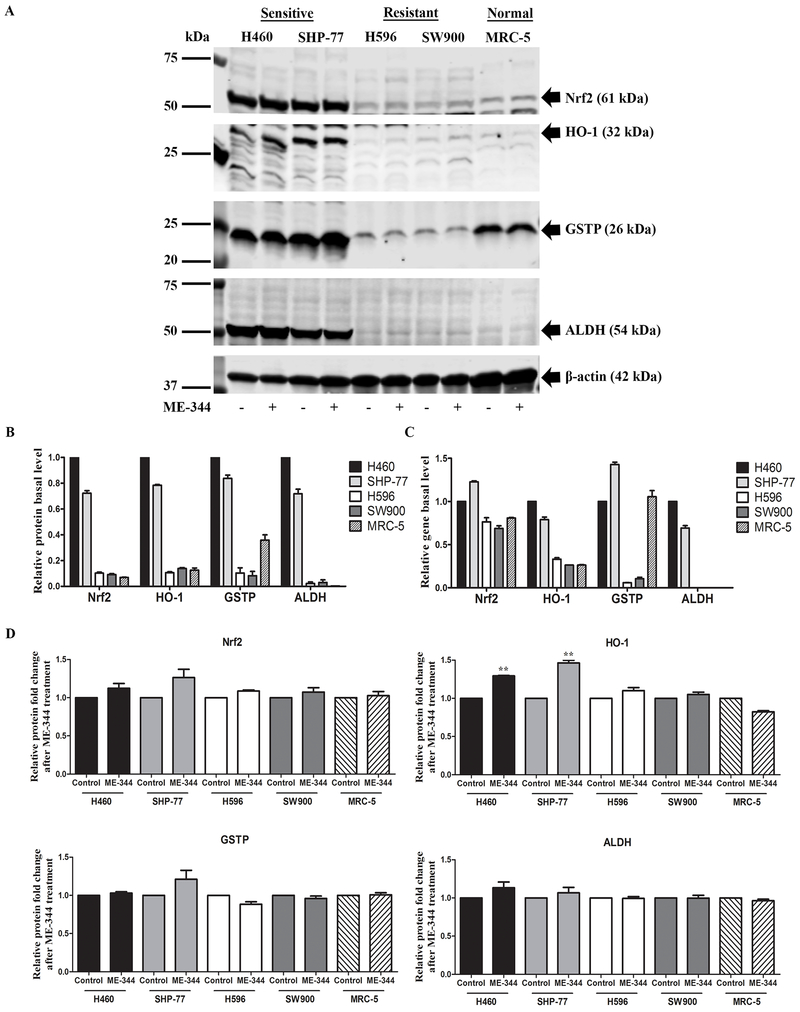
Figure 2. ME-344-induced changes in protein expression of Nrf2, HO-1, GSTP and ALDH in sensitive (H460 and SHP-77) and resistant (H596 and SW900) human lung cancer and normal cells (MRC-5).
Cells were treated with their IC50s for 24 h. A. Proteins were separated by SDS-PAGE and evaluated by immunoblots. B. Basal protein expression in untreated control cells was quantified by Image J software. Results are normalized to β-actin protein expression and relative to H460 cell line with mean values set at 1. C. Basal gene expression was analyzed by real-time PCR in untreated control cells. Relative gene expression quantification was based on the comparative threshold cycle (CT) method (2−ΔΔCt) with normalization of the raw data to the included housekeeping gene (18S rRNA) and relative to H460 cell line with mean values set at 1. D. The protein fold-changes after ME-344 treatment relative to untreated control cells were quantified by Image J software. Results are normalized to β-actin protein expression. Data are derived from three independent experiments and presented as means ± SEM in the bar graphs. *p < 0.05, **p < 0.01, ***p < 0.001 vs. the untreated control by Student’s t-test.

