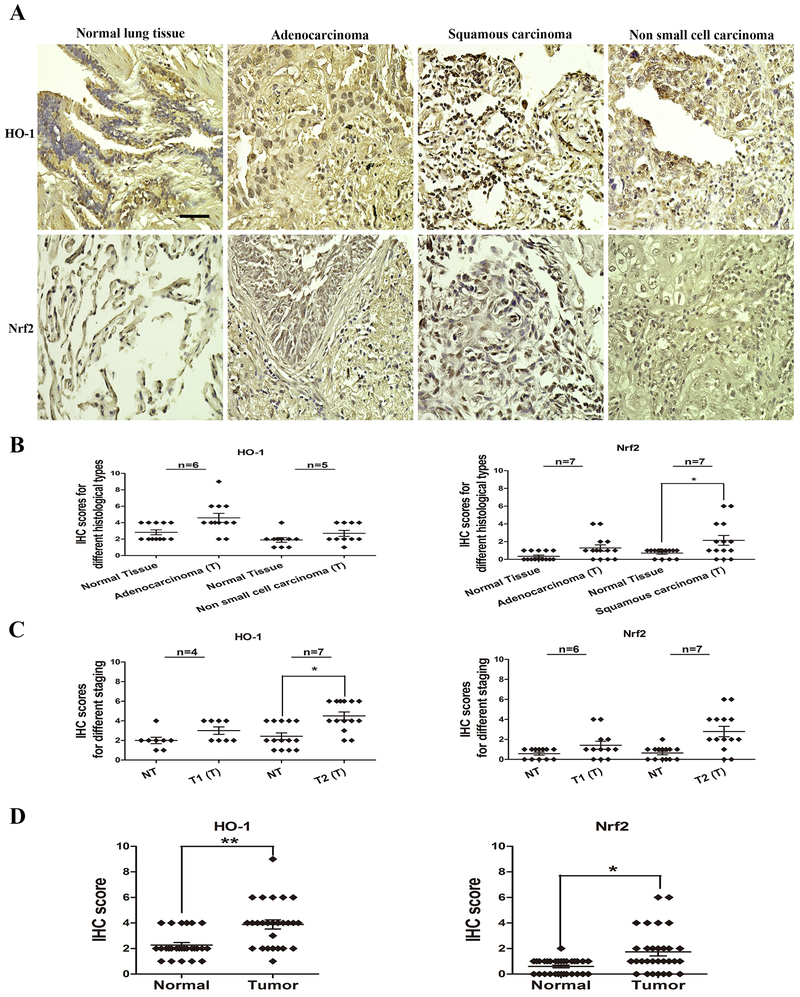
Figure 7. HO-1 and Nrf2 expression in normal and tumor human lung tissues by immunohistochemistry.
A. Representative IHC images of normal or tumor lung tissues. Paraffin sections from tissue microarrays were immunostained with anti-HO-1 and anti-Nrf2 antibodies (brown) and counterstained with hematoxylin (blue). Tumor cores of 13 and 14 different patients were present on the TMA1 (HO-1) and TMA5 (Nrf2), as well as adjacent normal lung tissue cores. There was strong brown staining in tumor lung tissues, but significantly lighter staining in normal tissues (magnification, x400; Bar = 50 μm). Immunohistochemistry analysis of HO-1 and Nrf2 protein levels in normal and tumor lung specimens of different histological types and different stages are shown in B and C. Immunoreactivity is scored as the percentage of positive cells (0–3) multiplied by the intensity of cellular staining (0–3). HO-1 and Nrf2 expression scores in all tissues are shown in D and E. HO-1 and Nrf2 expression patterns are significantly increased in lung tumor tissues. Data are derived from two independent experiments and presented as means ± SEM in the scatter graphs. *p < 0.05, **p < 0.01, ***p < 0.001 vs. the human lung normal tissue by Student’s t-test.

