Figure 3:
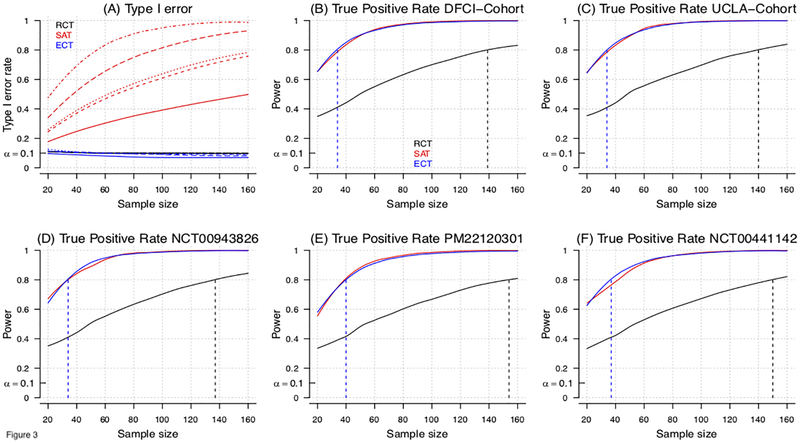
Model-based evaluation of the type I error and power for RCT, ECT and single-arm trial (SAT) designs for an overall study sample size of n=20, …, 160 patients. In the model-based approach (Supplementary-Material) we sampled baseline characteristics X from the five studies in Table 1, and generated outcomes Y from models Pr(Y|X, A). Panel (A) shows for all studies the type I error rates of RCT, ECT and SAT designs at different overall sample sizes. Different line types (solid, dashed, dotted, etc.) indicate different studies (Table 1). Panels (B-F) show for each study, the power of RCT, SAT and ECT designs, and sample size to achieve 80% power (dotted vertical lines). In panel A, the single arm trial experimental outcomes have been generated as in the ECT simulations, but outcomes Y are directly compared to the EORTC-NCIC CE.3 study estimates, without adjustments for different distributions of patients’ characteristics. For RCTs, half of the randomly selected profiles X are used to define the experimental arm and the remaining half defines the control arm. Two-group (RCT) and single-group (single arm trial) z-tests for proportions were used for testing. To compute the power in Panels B-F of the SAT, we assumed that the historical control benchmark πHC was correctly specified.

