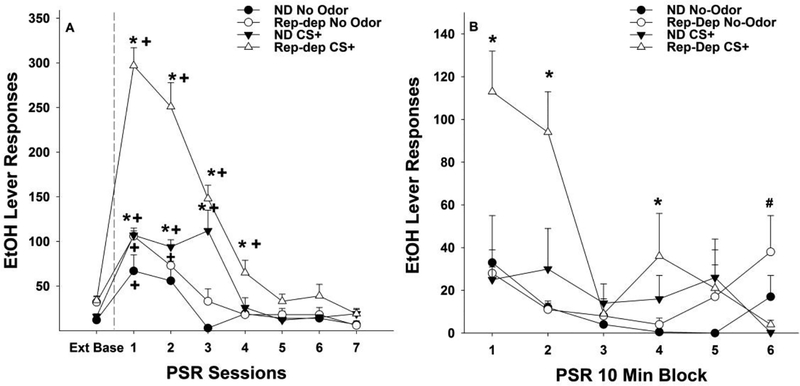
Figure 4:
Depicts the mean (± SEM) responses on the lever previously associated with the delivery of EtOH for the Repeated Deprivation (Rep-Dep) and Non-Deprived (ND) groups. Fig. 4A; Asterisk (*) indicates that rats in the CS+ groups responded significantly more than the No Odor groups for Rep-dep group during PSR sessions 1–4 and for ND group during session 1–3 (p <0.05). Plus (+) indicates that rats in the ND No Odor (PSR session 1), ND CS+ (PSR session 1–3) , Rep-Dep No Odor (PSR session 1 −2), and Rep-Dep CS+ (PSR sessions 1–4) groups responded significantly more on the lever previously associated with EtOH during PSR testing than extinction baseline (Ext Base) (p <0.05). Fig. 4B; Depicts the mean (±S.E.M.) responses per 10-min blocks on the lever previously associated with the delivery of EtOH in the ND No Odor group, ND CS+ group, Rep-Dep No Odor group, and Rep-Dep CS+ group during the first PSR session. Asterisk (*) indicates rats in the Rep-Dep CS+ group responded significantly (p < 0.05) more on the EtOH lever during the 1st, 2nd and 4th 10-min blocks of PSR testing compared to all other groups. Pound (#) indicates that the ND No Odor and Rep-Dep No Odor groups responded significantly (p < 0.05) more on the EtOH lever during the 6th 10-min block compared to the ND CS+ and the Rep-Dep CS+ groups.

