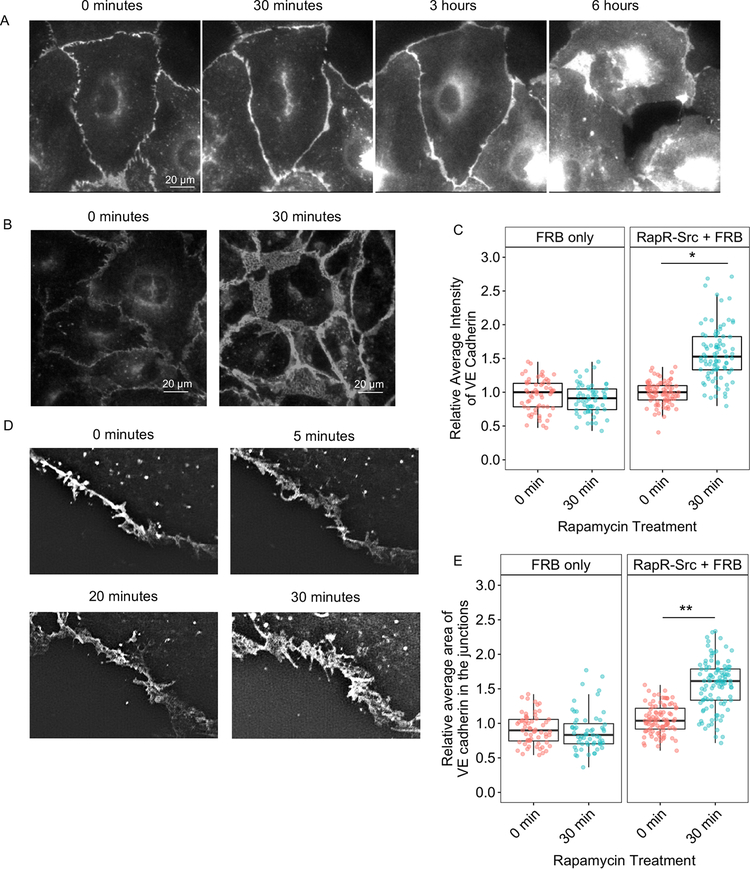
Figure 2: Effect of SRC activation on VE cadherin localization.
(A) Localization of overexpressed VE cadherin before and after RapR-SRC activation. HPAE cells expressing, RapR-SRC-cerulean, mCherry-FRB, and VE cadherin-GFP were imaged live. Representative wide-field images show VE cadherin-GFP distribution at the indicated time points before and after rapamycin addition. (B, C) Accumulation of endogenous VE cadherin at cell-cell contacts following SRC activation. HPAE cells expressing RapR-SRC-cerulean and mCherry-FRB or mCherry-FRB alone were treated with rapamycin (500 nM) for the designated amount of time, fixed, and stained for VE cadherin (Alexa488). (B) Representative wide-field images of endogenous VE cadherin before and 30 min after SRC activation. Images were taken using the same settings and adjusted to the same levels of brightness/contrast to show the difference in the amount of VE cadherin at the junctions. (C) Relative average intensity of VE cadherin before and after rapamycin treatment of cells expressing RapR-SRC and control cells (FRB only). (D and E) Broadening of AJs following SRC activation. (D) HPAE cells expressing VE cadherin-GFP, co-expressing RapR-SRC-cerulean and mCherry-FRB were imaged live using 3D-SIM. Images of the same region of AJs where taken at the indicated time points. (E) Change in AJ area following SRC activation. The relative area of AJs was determined for samples in B as described in Materials and Methods. (C and E). Values are normalized to the median value for 0 minutes and analyzed using a blocked ANOVA, ***p<0.001, *p<0.05 to compare across experiments. Box plots represent data quartiles. All exogenous proteins were expressed using adenoviral transduction. See also figure S2A.

