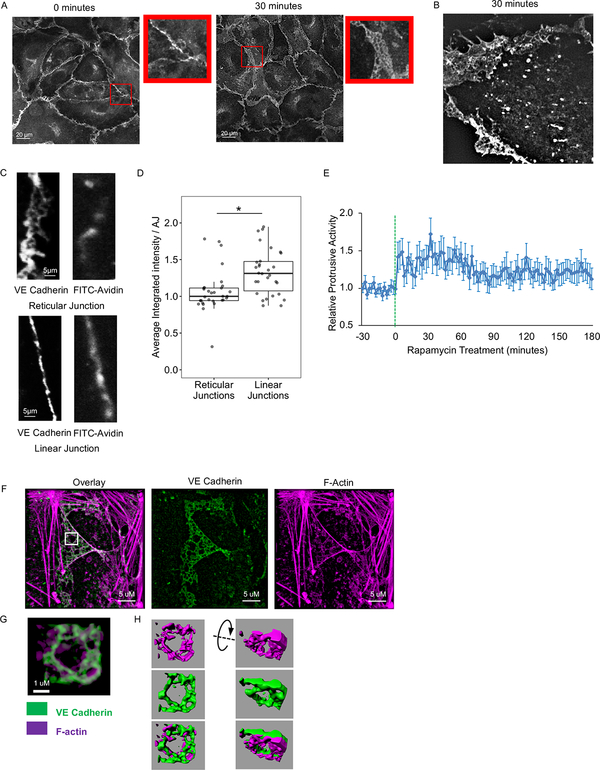
Figure 3: SRC-mediated formation and structure of reticular AJs.
(A and B) Formation of reticular AJs following SRC activation. (A) HPAE cells expressing RapR-SRC-cerulean and mCherry-FRB were treated with rapamycin for 0 or 30 minutes and stained for endogenous VE cadherin (Alexa488). Confocal images demonstrating the difference in the arrangement of VE cadherin at the junctions. Inserts show zoomed in area of the image to demonstrate organization of VE cadherin. (B) HPAE cells expressing RapR-SRC-cerulean-myc, mCherry-FRB, and VE cadherin-GFP were imaged live using a 3D-SIM microscope. VE cadherin-GFP image was taken at 30 minutes, post-rapamycin treatment (500 nM). (C and D) Localized permeability of linear and reticular AJs. HPAE cells were analyzed using a FITC-avidin permeability assay. FITC-avidin was added to cell media for 2 minutes, cells were then washed, fixed, and stained for endogenous VE cadherin (Alexa647). The amount of FITC-avidin detected at the junction reflects its permeability. (C) Representative images of VE cadherin and FITC-avidin. (D) Quantification of local FITC-avidin permeability. The average integrated intensity of FITC-Avidin was measured under 30 reticular (>4.5 μm wide) and 30 linear (<2.5 μm wide) AJs, designated by endogenous VE cadherin staining. Results are collected from 3 independent experiments. A two-sample t-test was used to compare the two types of junctions. ***p < 0.001. Box plots represent data quartiles. (E) Changes in protrusive activity of HPAE cells following activation of SRC. HPAE cells co-expressing RapR-SRC-cerulean, mCherry-FRB, and the membrane marker Stargazin-mVenus were imaged live every 2 minutes. Transient transfection was used to express Stargazin. Rapamycin was added a time point 0 (500 nM, green line). Protrusive activity was calculated and standardized to the average activity for each cell prior to rapamycin treatment (N=30 cells). Error bars represent the 90% confidence interval for each time point. (F-H) Organization of reticular AJs. HPAE cells co-expressing RapR-SRC-cerulean and mCherry-FRB were treated with rapamycin (500 nM) for 30 minutes, fixed, and stained for endogenous VE cadherin (Alexa488) and F-actin (Phalloidin-Alexa647). Immunofluorescence images were collected using a Nikon SIM microscope. (G) Zoomed in area from the indicated white square in B. (H) 3D representation of VE cadherin (green) and actin (purple) organization in the zoomed in area in C. 3D renderings were generated using IMARIS software. All exogenous proteins were expressed using adenoviral transduction unless notated otherwise. See also Figure S2B and Movie 2.

