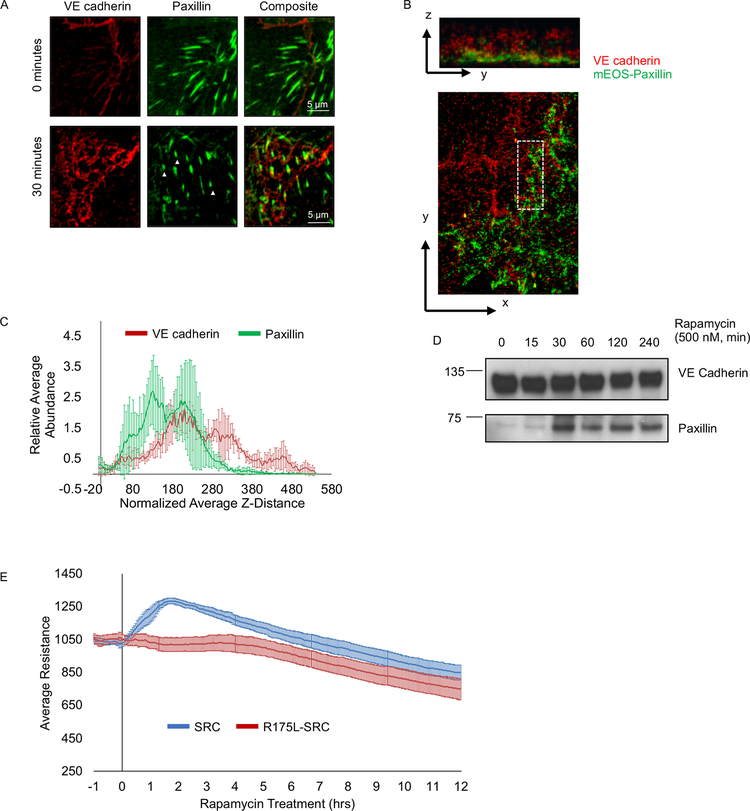
Figure 4: Organization of focal adhesions in reticular AJs.
(A) Presence of focal adhesions in reticular junctions. HPAE cells co-expressing RapR-SRC-cerulean and mCherry-FRB were treated with rapamycin (500 nM) for 0 or 30 minutes, fixed, and stained for VE cadherin (Alexa488) and Paxillin (Alexa647) and imaged via confocal microscopy. Arrowheads indicate focal adhesions in reticular junctions. (B and C) Analysis of VE cadherin and paxillin organization in reticular junctions using iPALM. SRC was activated for 30 minutes in HPAE cells co-expressing RapR-SRC-cerulean, FRB, and td-EOS-paxillin, fixed cells were stained for VE cadherin (Alexa647) and imaged on an iPALM microscope. (B) Representative image showing z-(top image) and x-y-projection (bottom image) of VE cadherin arranged in a reticular structure. (C) Distribution of paxillin (green) and VE cadherin (red) in Z within overlapping reticular junctions (indicated by white rectangle in (B)). The average relative abundance of VE cadherin and paxillin in Z was measured in 3 distinct regions containing reticular junctions, 4–6 sub-regions were analyzed per region. Analyzed regions are shown in Figure SI 2C. (D) Association of paxillin with VE cadherin following SRC activation. SRC was activated for the designated amount of time in HPAE cells co-expressing RapR-SRC-cerulean and mCherry-FRB. VE cadherin was immunoprecipitated from cell lysates and immunoblotted with designated antibodies. (E) Role of SRC SH2 domain in regulation of endothelial barrier. HPAE cells co-expressing RapR-SRC-cerulean (SRC) and mCherry-FRB or RapR-SRC-R175L-cerulean (R175L, SRC SH2 mutant) and mCherry-FRB were analyzed using TER. Rapamycin (500 nM) was added at time point 0. Graphs represent the average resistance and 90% confidence interval from 3 independent experiments. All exogenous proteins were expressed using adenoviral transduction, except for td-EOS-paxillin which was transiently transfected. See also Figure S2D–E.

