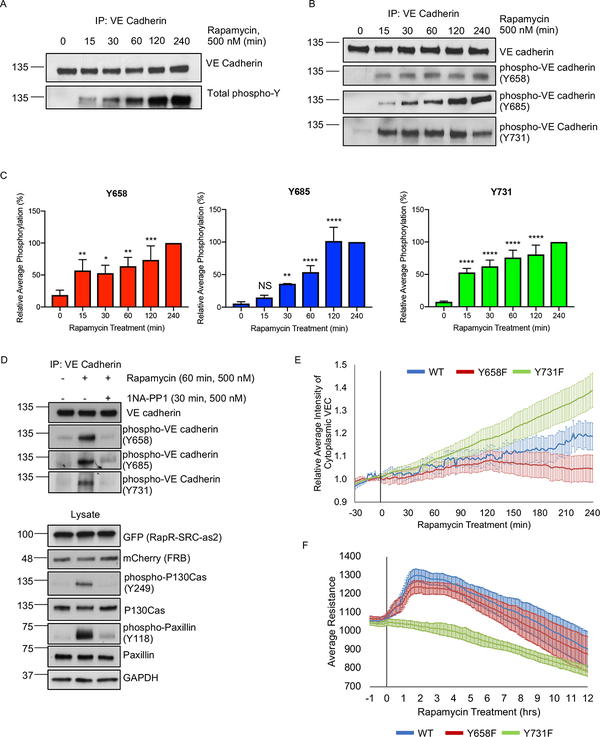
Figure 5: The role of VE cadherin phosphorylation in SRC-mediated regulation of endothelial cell-cell barrier.
(A-C) Phosphorylation of VE cadherin following activation of SRC. HPAE cells co-expressing RapR-SRC-cerulean and mCherry-FRB were treated with rapamycin (500 nM) for the designated amount of time. Endogenous VE cadherin was immunoprecipiated and analyzed by western blot. (A) Total VE cadherin Tyrosine phosphorylation. (B-C) Phosphorylation of VE cadherin at specific Tyrosine sites: Y658 (n=6), Y685 (n=5), and Y731 (n=6). For each experiment, all time points were normalized to 4h time point. Error bars represent standard deviation. Statistical significance was evaluated using a two-way ANOVA with repeated measures and a post-hoc test with a Bonferroni’s multiple comparisons test. *p < 0.05, ***p < 0.001, ****p < 0.0001. (D) Inactivation of RapR-SRC resulted in a return to basal VE cadherin phosphorylation levels. RapR-SRC-cerulean-as2 and mCherry-FRB cells were activated with rapamycin (500 nM) for 60 min, at which time either DMSO or the allele specific inhibitor 1NA-PP1 (500 nM) was added for an additional 30 min. Lysates were collected at 90 min post rapamycin treatment, VE cadherin was immunoprecipitated and probed for Y658, Y685, and Y731 phosphorylation. See also figure S4A–B. (E) The role of Y658 and Y731 in VE cadherin localization. HPAE cells co-expressing RapR-Src-cerulean, mCherry-FRB, and the indicated VE cadherin-GFP construct (wild-type (WT), Y658F, or Y731F mutant) were imaged live and the amount of cytoplasmic VE cadherin was calculated for each time point. Rapamycin (500 nM) was added at 0min time point. All values were normalized to the average cytoplasmic VE cadherin intensity prior to rapamycin treatment. Error bars show 90% confidence intervals. (F) The role of VE cadherin phosphorylation on Y658 and Y731 in Src-mediated regulation of endothelial barrier. HPAE cells co-expressing RapR-Src-cerulean, mCherry-FRB, and the indicated VE cadherin-GFP construct (wild-type (WT), Y658F, or Y731F mutant) were analyzed by TER and were treated with rapamaycin (500 nM) at time 0. Graph represents the average resistance from 3 independent experiments and error bars show 90% confidence intervals. All exogenous proteins were expressed using adenoviral transduction. See also figures S5A–D.

