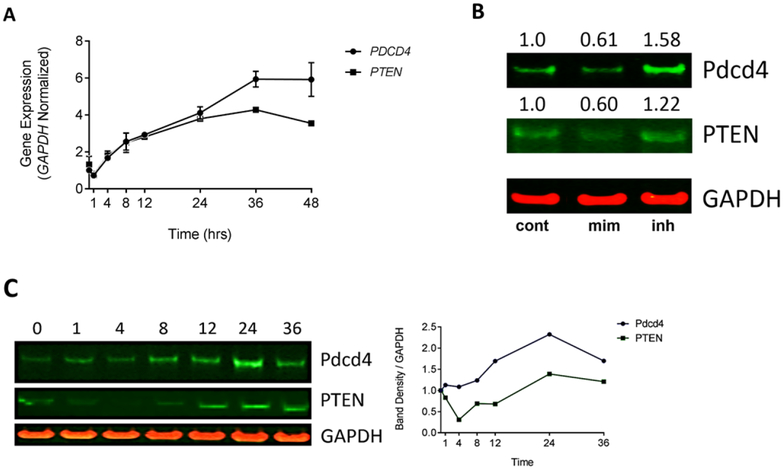
Figure 4: HCT-116 cells treated with 1 upregulate miR-21 target genes PDCD4 and PTEN.
(A) PDCD4 and PTEN mRNA expression was measured by RT-qPCR and showed significant upregulation up to 36 hr post-treatment with 1. GAPDH was used as an internal control. (B) HCT-116 cells were treated with DMSO (lane 1) or 30 nM miR-21 mimic (lane 2) or inhibitor (lane 3) and were analyzed for Pdcd4 and PTEN expression level 48 hr post-transfection. Lipofectamine 2000 was used as the transfection agent. Band density was normalized to GAPDH. Fold change (value shown) was determined by double normalizing to GAPDH and the DMSO control. (C) HCT-116 cells were treated with 50 nM 1 and cells were harvested for protein extraction at time points ranging from 0–36 hours post-treatment. Anti-Pdcd4/anti-PTEN was used to detect expression levels of Pdcd4 and PTEN and GAPDH was used as an internal control. Band density was quantified and double normalized GAPDH and time point 0. All experiments were performed in triplicate, western blots are representative of 3 replicates.

