Fig. 5.

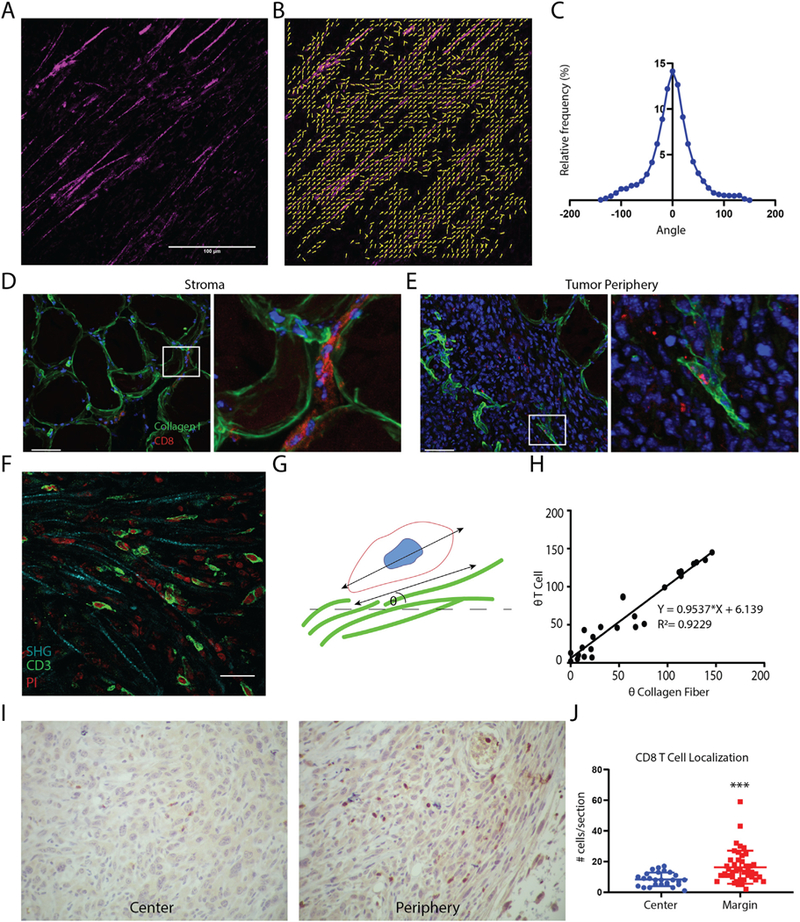
CD8+T cells colocalize with aligned collagen I fibers in tumors. (A) Representative SHG image of TRAMPC2 xenograft tumors. (B) Matfiber alignment vectors of SHG image. (C) Histogram of collagen alignment profiles in TRAMPC2 tumors (n = 8 tumors) Xenograft tumors (n = 4) stained for collagen I (green) and CD8 (red; nuclei in blue): (D) Left-Stromal regions adjacent to TRAMPC2 subcutaneous xenograft tumors and right- high magnification of the boxed area on the right, showing CD8+ T cells localized between collagen fibers. (E) Right - periphery of TRAMPC2 tumors depicting infiltrating CD8+ T cells and right- high magnification of the boxed area on the right, showing CD8+ T cell located along aligned collagen fibers. Scale bars = 50 μm. (F) Photomicrograph depicting T cells crawling along collagen fibers using SHG imaging (G) Schematic depiction of method for quantifying T cell association with collagen fibers. (H) Scatter plot of collagen fiber and T cell angles (n = 26 cells) showing positive correlation. (I) CD8 immunostaining of central regions and peripheral regions of TRAMPC2 tumors. (J) Quantification of CD8+ cells within different regions of the tumor. (For interpretation of the references to colour in this figure legend, the reader is referred to the web version of this article.)
