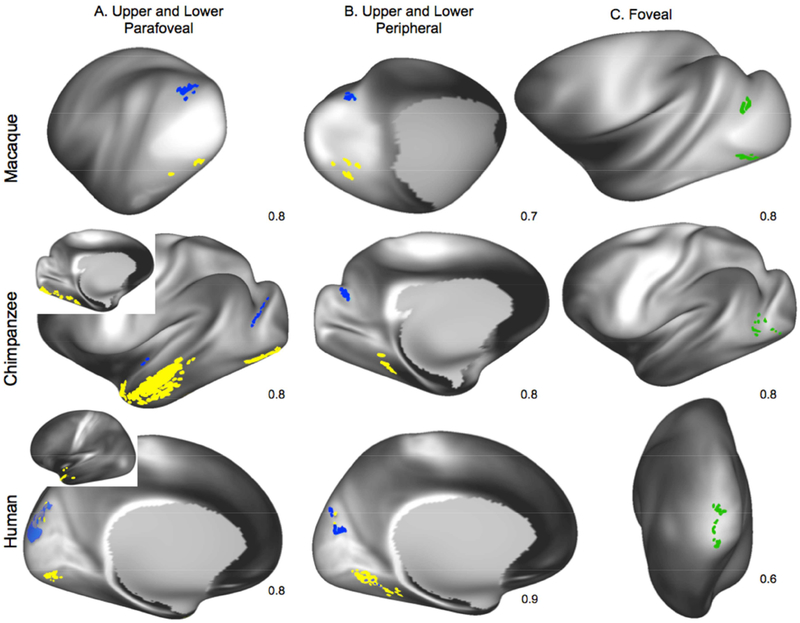
Figure 6:
Averaged retinotopic tracking results in humans, chimpanzees, and macaques. Blue areas temporal seed voxels with apparent major connectivity with lower parafoveal (A) and peripheral (B) V1 ROIs; yellow areas represent apparent major connectivity to upper parafoveal (A) and peripheral (B) V1 ROIs. Green areas in C represent results with foveal ROIs. Numbers in lower right corner of each map indicate the percentage of individual results included to produce the final averaged result. Threshold for all subjects=0.5 hits per vertex per 1000 streamlines except for human peripheral and parafoveal results, which are at 0.25 hits per 1000 streamlines; population threshold=80% of subjects.

