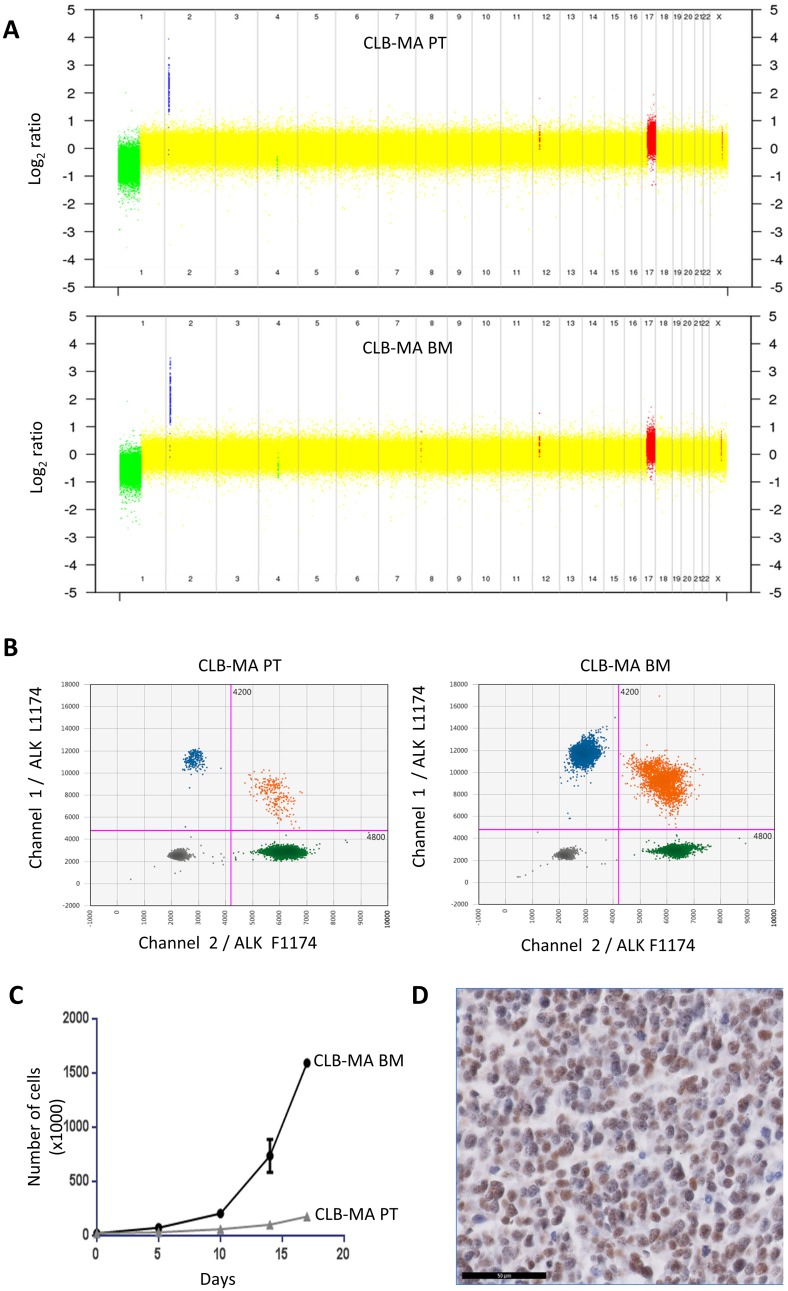
Figure 1. Genomic alterations and growth of the CLB-MA PT and CLB-MA BM neuroblastoma cell lines.
(A) The copy number profile obtained on CytoScan® HD arrays shows MYCN amplification (blue), 1p loss (green) and 17q gain (red) in both cell lines. (B) Droplet digital PCR (ddPCR) indicates a fraction of 2.5% of the ALK F1174L mutation in the CLB-MA-PT cell line whereas this mutation is present at a fraction of 49.6% in the CLB-MA-BM cell line. Green and blue dots represent droplets containing only ALK F1174 or ALK L1174 sequences, respectively. Orange dots correspond to mixed droplets containing both the ALK WT F1174 and the ALK mutated L1174 sequences. Grey dots correspond to empty droplets. (C) In vitro proliferation of CLB-MA BM and CLB-MA PT cells at passage 6. 20,000 cells were plated in 12-well plates and cells were counted at days 5, 10, 14 and 17. (D) PHOX2B immunohistochemistry performed on an orthotopic xenograft of CLB-MA BM cell line. Scale bar: 50 μm.

