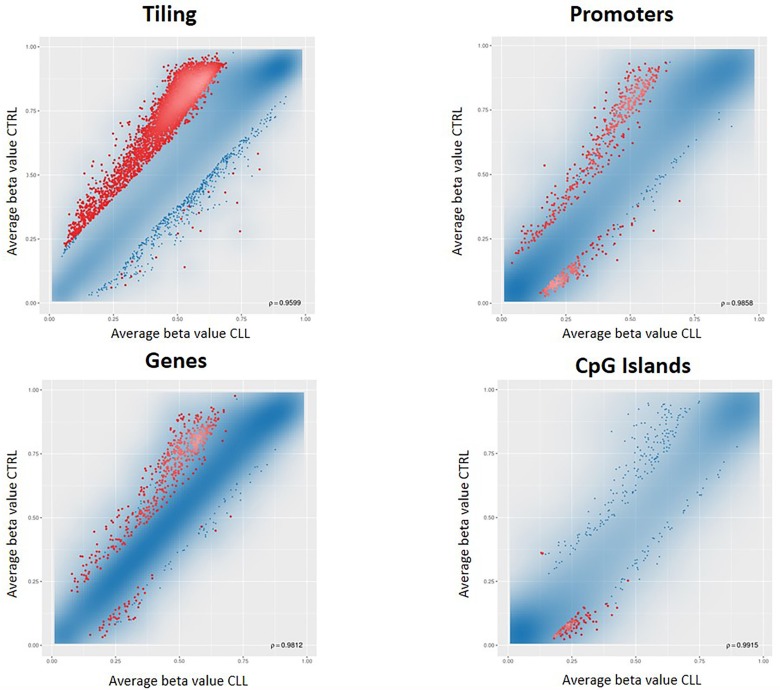
Figure 2. RnBeads differential methylation analysis for tiling, genes, promoters and CpG islands.
Each dot represents the average beta value for each CpG locus in the region, resulting from the average of the samples belonging to that group. Red dots indicate CpG loci significantly differentially methylated between the two groups.

