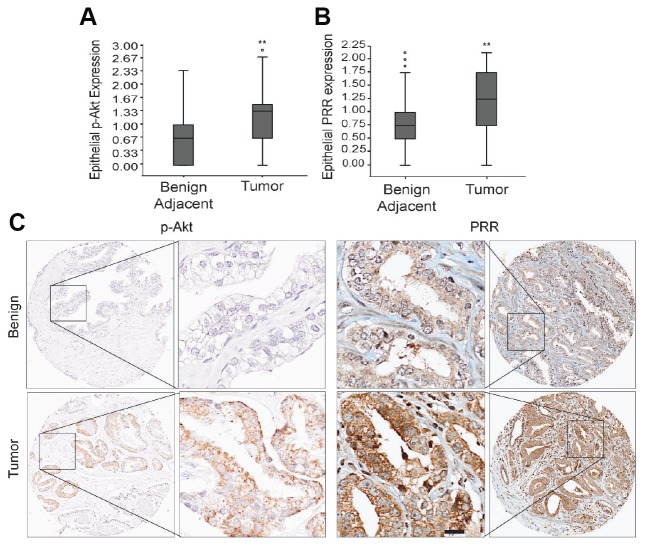
Figure 2. Analysis of p-Akt and PRR expression in prostate cancer tissue microarrays.
Box and Whisker plots demonstrating the distribution of (A) phosphorylated Akt (p-Akt) (** P < 0.01) (benign adjacent, upper extreme (UE)=2.33, upper quartile (UQ)=1.0, median (M)=0.67, lower quartile (LQ)=0.00, lower extreme (LE)=0.00; tumor, outlier (O)=2.82, UE=2.67, UQ=1.45, M=1.33, LQ=0.67, LE=0.00) and (B) Prorenin Receptor (PRR) (** P < 0.01) (benign adjacent, O=2.1, 1.98, 1.84, UE=1.75, UQ=1.00, M=0.75, LQ=0.50, LE=0.00; tumor, UE=2.15, UQ=1.75, M=1.25, LQ=0.75, LE=0.00) staining intensity scores (0-3) evaluated by IHC in Benign adjacent and tumor tissues from 285 radical prostatectomy specimens arrayed on Tissue microarrays. (C) Representative whole and IHC images (20×) of p-Akt and PRR stained benign and tumor tissue microarrays showing the increased expression of PRR and p-Akt in tumor tissue microarrays relative to benign tissue. Scale bar measures 200 μm. Statistical tests conducted using Student’s t test.

