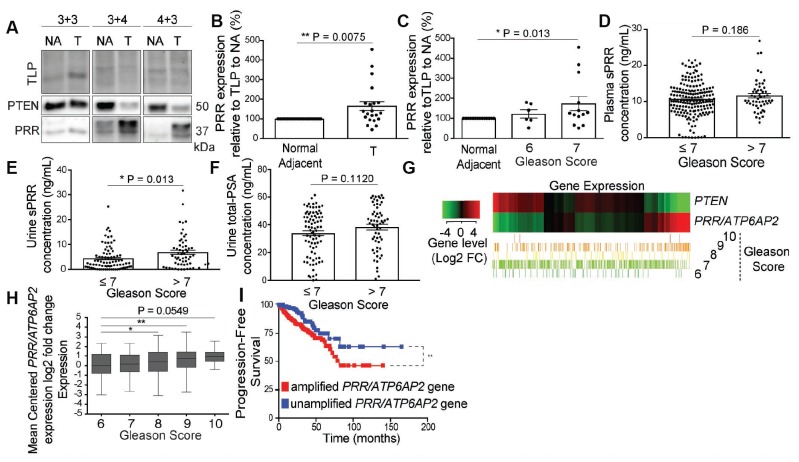
Figure 5. PRR expression increases in tumor tissue, correlates with Gleason score, and sPRR is elevated in urine of patients with aggressive prostate cancer.
(A) Representative Western blot analysis demonstrating dampened Phosphatase and tensin homolog (PTEN) expression in tumor (T) tissue of patient prostates with Gleason grade 3+4 and 4+3 but not in 3+3 Gleason grade compared to normal adjacent tissue (NA) from the same prostate of each patient. Also, Prorenin Receptor (PRR) expression is increased in the tumor tissue in which PTEN expression is decreased (3+4, and 4+3 Gleason grade patients). Total lane Protein (TLP) was used as a loading control. (B) Quantification of PRR expression shows an increase in PRR expression in the tumor tissue compared to normal adjacent across all the Gleason grades (** P = 0.0075) (n = 21). (C) Stratification of PRR expression over Gleason grades 6 (n = 6) and 7 (n = 13) from the same patients shows a significant increase in PRR expression in Gleason 7 (* P = 0.042) but not in Gleason 6 patients. (D) ELISA on Plasma samples from prostate cancer patients shows no significant difference in soluble Prorenin Receptor (sPRR) concentration (ng/mL) between Gleason grade groups ≤7 (n = 190) and >7 (n = 53) (P = 0.186). ELISA analysis shows a significant increase in sPRR concentration (* P = 0.013) (E) but not in prostate specific antigen (PSA) concentration (P = 0.112) (F) (ng/mL) in urine samples from Gleason score >7 (n = 60) compared to ≤7 (n = 83) patients. Data are presented as the mean ± SEM. Statistical tests conducted using Student’s t test. (G) Heat map showing the mRNA expression profile of PTEN and PRR/ATP6AP2 genes across 551 genomic data commons (GDC) of the cancer genome atlas (TCGA) prostate adenocarcinoma (PRAD) tumors, classified based on unsupervised hierarchical clustering into Gleason scores 6 (n = 51), 7 (n = 287), 8 (n = 67), 9 (n = 142), and 10 (n = 4). (H) Box and Whisker plots showing the log 2-fold differential expression of the gene PRR/ATP6AP2 across TCGA samples grouped by 6 (upper extreme = 2.30, upper quartile = 1.16, median = 0.04, lower quartile = –0.90, lower extreme = –3.09), 7 (2.26, 1.07, 0.07, –0.70, –2.71), 8 (3.07, 1.31, 0.32, –0.65, 3.15) (* P = 0.02), 9 (3.43, 1.38, 0.70, –0.29, –2.81) (** P = 0.002), and 10 (2.51, 1.29, 0.88, 0.36, –0.51) (P = 0.054) Gleason scores. Significance was determined by the Wilcoxon rank T-Test as compared to Gleason-6. (I) Kaplan-Meier plot showing less progression-free survival of TCGA prostate adenocarcinoma patients with an amplified PRR/ATP6AP2 gene set (n = 321) compared to patients with an unamplified PRR/ATP6AP2 gene set (n = 170) (** P < 0.0086). Statistical analysis was conducted using the Logrank test to compare the survival distributions of the two patient populations.

