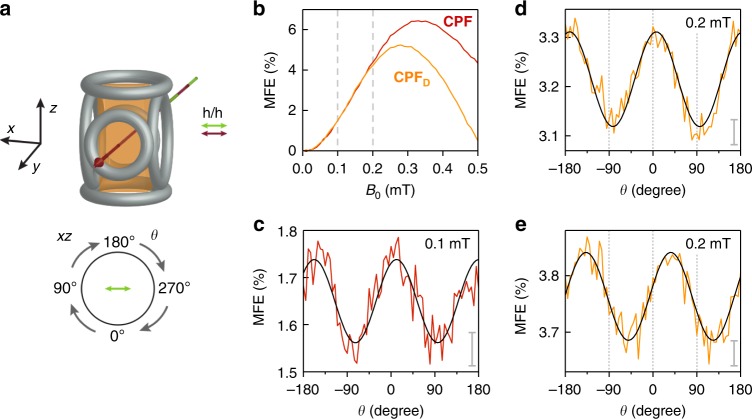
Fig. 2.
Orientation dependence of the magnetic field effect (MFE) of CPF. a Illustration of the experimental geometry. x, y and z indicate the three laboratory axes, θ defines the angle between the −z axis and the applied magnetic field. The polarisation axes of the pump and probe beams are parallel and are indicated in the figure. b MFE for CPF (red) and CPFD (orange) as a function of applied field. The field positions where the anisotropy curves were recorded are indicated by vertical dashed lines. c MFE of CPF, recorded at 100 μT as a function of θ. d MFE data for CPFD, recorded at 200 μT as a function of θ. e MFE recorded for CPFD and same parameters as d but recorded with the polarisation directions of both pump and probe beam rotated by 45° in the xz plane. The data shown in all panels were averaged over a time window from 0.07 to 0.09 μs after laser excitation. The grey bars in panels c–e indicate the (average) standard deviation of the mean. The black solid lines represent best sinusoidal fits to the data

