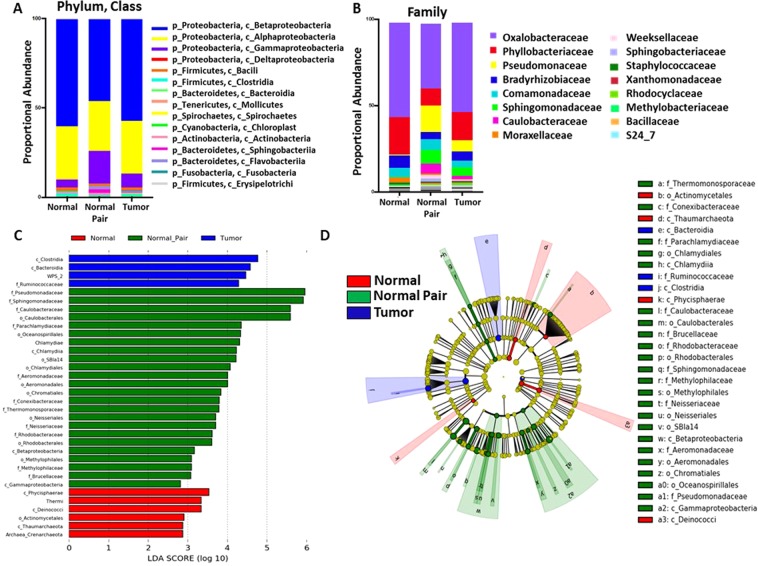
Figure 2.
Breast microbiota are distinct between normal, normal pair, and tumor breast tissues. (A) Taxonomic profiles of normal (n = 8), normal pair (n = 11), and breast tumor tissue (n = 64) microbiota at phylum level and (B) family level for taxa with a relative abundance >0.5% are shown. (C) Linear Discriminate Analysis (LDA) scores predict microbiota associated with normal (n = 8), normal pair (n = 11), and breast tumor tissue (n = 64) microbiomes. (D) Circular cladogram of differentially abundant taxa increased in normal (n = 8), normal pair (n = 11), and breast tumor (n = 64) tissues. Each letter in concentric ring of nodes represents a taxonomic rank by either class, order, or family. Black arrows indicate taxa identified as significantly increased in normal tissues as compared to breast tumors.

