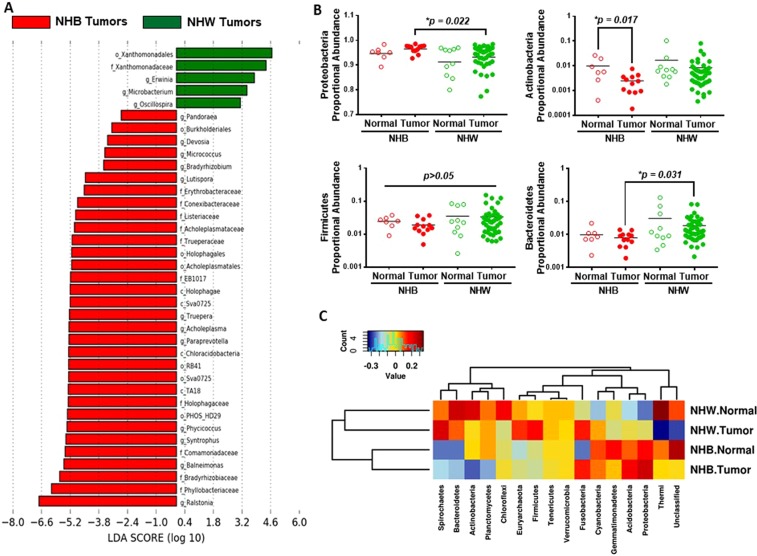
Figure 4.
Proportional abundances of breast microbiota differ by race. (A) LDA scores were computed for the most differential microbiota abundance between breast tumors by race. (B) Scatter plots illustrating the proportional abundance of the four major phyla (Proteobacteria, Actinobacteria, Firmicutes, and Bacteroidetes) between normal (n = 19, including normal pairs) and breast tumor (n = 64) tissues of AA (and EA women. A p < 0.05 is considered statistically significant. (C) Spearman heatmap illustrating levels of phyla in breast tumors between NHB and NHW women. Blue color represents rare or absent phyla while red color represents abundant phyla. Hierarchical clustering of phyla and sample types are displayed as dendrograms.

