Fig. 1.
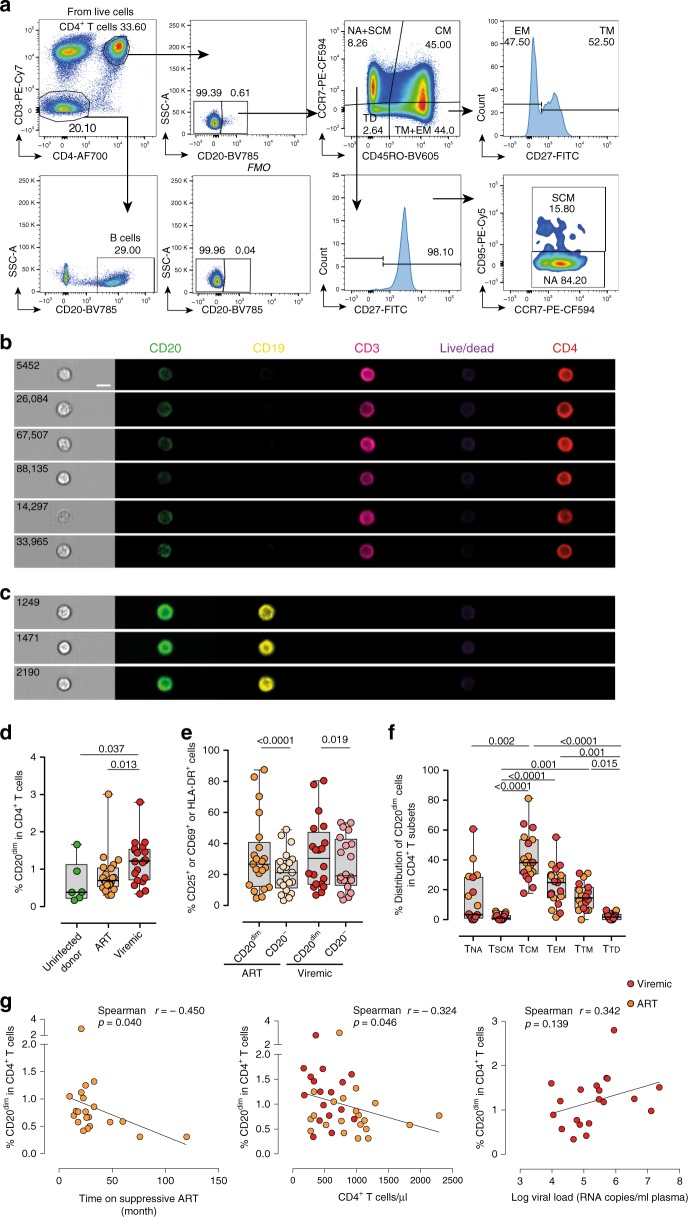
CD20dim CD4+ T cells involve memory phenotypes with more activation than CD20− cells. PBMC from uninfected donors, ART-suppressed patients and viremic patients were stained with CD20, activation markers (HLA-DR, CD69, CD25), and T-cell differentiation markers (CCR7, CD45RO, CD27, CD95). a Gating strategy used to identify CD20dim CD4+ T cells. Previous sequential gates are represented in Supplementary Fig. 9. Viable CD4+ T cells (identified by CD3 and CD4 expression) were first selected for the analysis of CD20 expression, defined by its Fluorescence Minus One (FMO) control. T-cell memory subsets were selected as follows: CD4+ TNA (CCR7+, CD45RO−, CD27+, CD95−), CD4+ TSCM (CCR7+, CD45RO−, CD27+, CD95+); CD4+ TCM (CCR7+, CD45RO+), CD4+ TTM (CCR7−, CD45RO+, CD27+); CD4+ TEM (CCR7−, CD45RO+, CD27−), CD4+ TTD (CCR7−, CD45RO−). b, c Representative bright-field and pseudo-color fluorescence images of CD20dim CD4+ T cells (b) and B cells (c) from two ART-suppressed patients (#9 and #22) using the Amnis imaging flow cytometer technology. Scale bar 10 µm. d Percentage of CD20dim expression within CD4+ T cells in uninfected controls and the two patient cohorts. Mann–Whitney comparison was used to compare n = 6 uninfected controls, n = 21 ART-suppressed patients, n = 20 viremic patients. e Expression of the activation markers CD25, CD69 or HLA-DR in CD20dim and CD20− CD4+ T cells in different cohorts of HIV+ patients. Comparisons were performed using the two-tailed Wilcoxon test (n = 21 ART-suppressed patients and n = 20 viremic patients). f Distribution of CD20dim in CD4+ T-cell subsets in ART-suppressed (orange) and viremic (red) HIV-infected patients. NA, naive; SCM, memory stem cell; CM, central memory; TM, transitional memory; TD, terminal differentiated. ANOVA and Dunn’s multiple comparison test were performed, n = 10 ART-suppressed and n = 9 viremic patients. Median values and min and max ranks are represented in panels d–f. g Correlation of CD20dim CD4+ T cells with time on suppressive ART (left), CD4+ T-cell counts (middle) and plasma viral load (right) are shown. ART-suppressed patients in orange and viremic patients in red. Spearman’s nonparametric correlation coefficients and associated P values are shown. Panels (d) and (e) included patients #2–10, 15–26, 60–65, 67–74, and 76–81. Panel (f) patients #1–10, 60–65, and 67–69. Panel (g) patients #2–10, 15–26, 60–65, 67–74, and 76–81. Data underlying this Figure are provided as Source Data file

