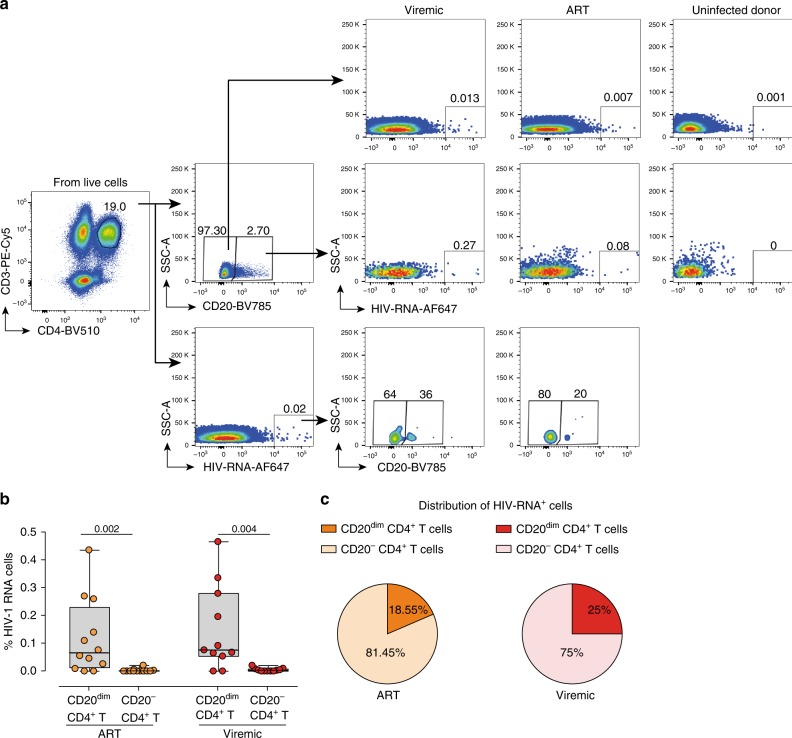
Fig. 2.
CD20dim CD4+ T cells are enriched in HIV-1 RNA. Unstimulated PBMCs were subjected to the RNA FISH-flow protocol to detect HIV RNA expression in CD20dim CD4+ T cells. a Gating strategy used to determine the HIV RNA expression on CD20− and CD20dim CD4+ T cells and expression of CD20 in HIV RNA+ cells. Previous sequential gates are represented in Supplementary Fig. 9. b Frequency comparison of HIV RNA+ cells in CD20dim CD4+ T cells and CD20− CD4+ T cells of ART-suppressed and viremic patients. Wilcoxon test was used. c Mean distribution of HIV RNA+ cells in the CD20+ and CD20− phenotypes. Median values and min and max ranks are represented in panels (b) and (c). In all panels, n = 12 ART-suppressed and n = 11 viremic patients are shown. Data from patients #15–26, 60, 63, and 73–81 are included. Data underlying this Figure are provided as Source Data file

