Fig. 3.
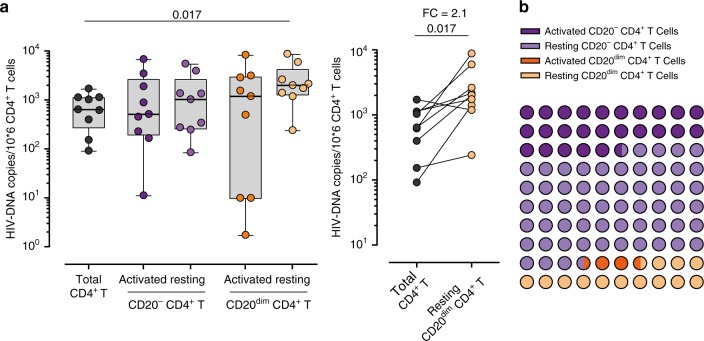
HIV-1 DNA quantification in CD20dim CD4+ T cells. HIV DNA was measured in sorted CD4+ T cells (black), activated CD20− CD4+ T cells (dark violet), resting CD20− CD4+ T cells (light violet), activated CD20dim CD4+ T cells (dark orange), and resting CD20dim CD4+ T cells (light orange) in PBMCs from nine ART-suppressed patients. The activation state was defined by the expression of HLA-DR, CD69 or CD25 markers. a Copies of viral DNA molecules per 106 CD4+ T cells are represented for all sorted populations (left panel). Medians and min–max rank are represented. Comparison of HIV DNA copies per 106 cells between CD4+ T cells and resting CD20dim CD4+ T cells with the fold-change (FC, right panel). Comparisons were performed using the Wilcoxon test. b Contribution of each cell population to the total pool of HIV DNA. In panels (a) and (b), data from patients #11–14, 19, and 27–30 are shown. Data underlying this Figure are provided as Source Data file

