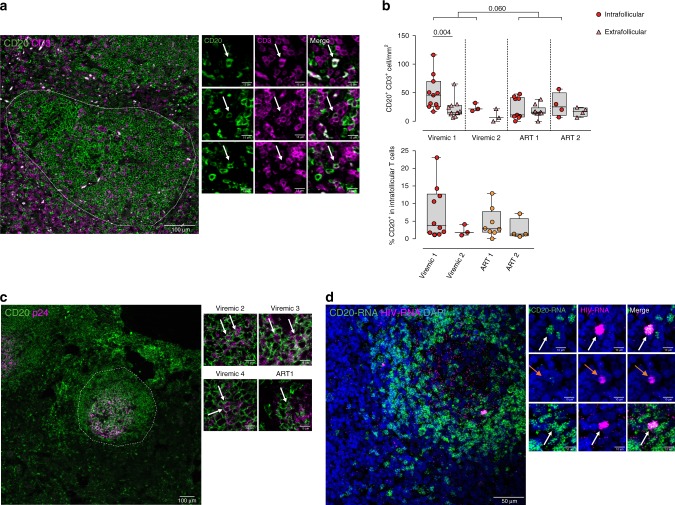
Fig. 4.
CD20 expression in T cells of intact human lymph nodes. Paraffin-embedded lymph node sections from HIV-infected patients were stained with anti-CD20 combined with anti-CD3 (a) or anti-p24 antibodies (b), alternatively sections were proceed for in situ RNA-hybridization of CD20-mRNA or mRNA and HIV RNA (c). a Representative micrograph of a lymph node section from one viremic HIV+ patient stained with anti-CD20 (green) and anti-CD3 (violet) antibodies. The discontinuous line indicates a B-cell follicle and the white arrows double positive cells. Right panels correspond to zoomed views from different patients. b Upper panel shows the number of cells per mm2 expressing CD20+ and CD3+ in lymph nodes (circles, each dot corresponds to one follicle) and in the extrafollicular region (triangles, each dot corresponds to one optical field). Two HIV-viremic (#84 and 85, in red) and two ART-suppressed patients (#31 and 32, in orange) are shown. Comparison between values inside B-cell follicles from viremic and ART-suppressed patients was performed using a Mann–Whitney test, and comparison within viremic 1 was performed with the Wilcoxon test. Lower panel shows the percentage of CD3+ cells within the B-cell follicle expressing CD20. Each dot corresponds to one follicle. Medians and min–max rank are represented. c Representative micrograph from a lymph node section from one HIV-viremic patient stained with anti-CD20 (green) and anti-p24 (violet) antibodies. High magnification images correspond to B-cell regions from different ART-suppressed and viremic patients, white arrows indicate double positive cells and the discontinuous line indicates B-cell follicle. Patients #31 and 82–84 are shown. d Representative image of a B-cell follicle section from one viremic patient (#82) subjected to the in situ hybridization technique. CD20-mRNA is represented in green and HIV RNA in violet. At the middle, zoomed images of double positive cells (white arrows) or HIV RNA single positive cells (orange arrows). Data underlying this Figure are provided as Source Data file

