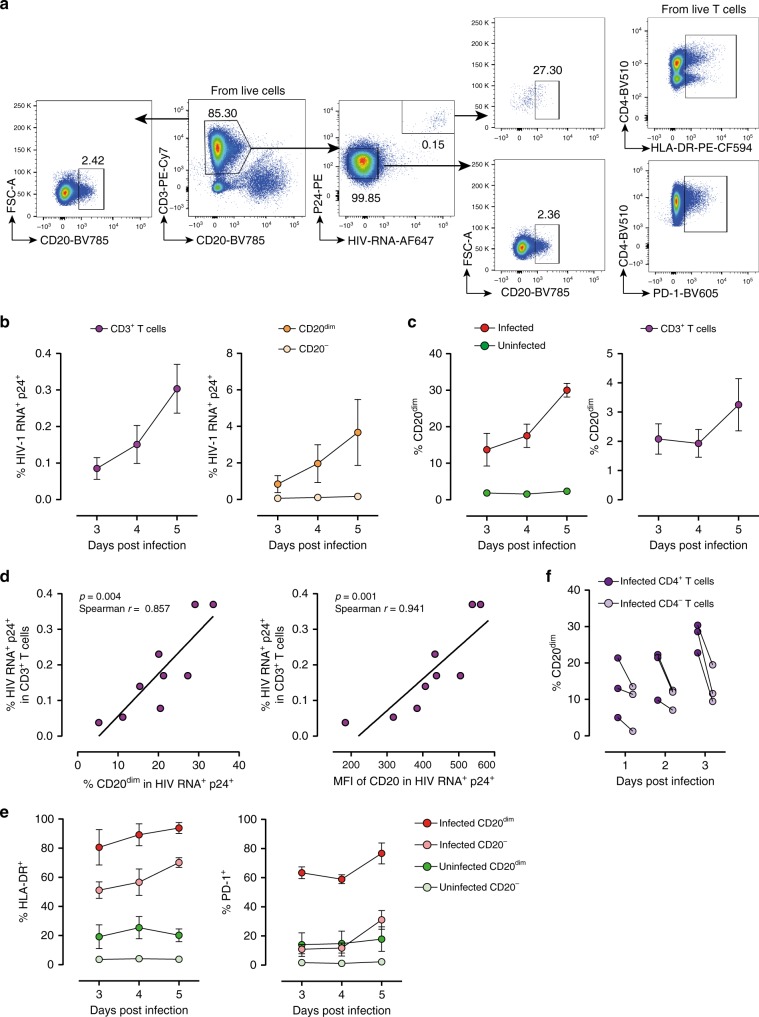
Fig. 5.
Ex vivo infection upregulates CD20 expression. Unstimulated PBMCs from three uninfected donors were infected with HIV strain NL4.3. Infection was monitored by simultaneous staining of HIV RNA using the RNA FISH-flow assay and the viral protein p24 at days 3, 4, and 5. a Gating strategy used to monitor HIV infection and expression of CD20dim. Previous sequential gates are represented in Supplementary Fig. 9. b Percentage of productively HIV-infected cells in CD3+ T cells (left panel) and in CD20dim or CD20− CD3+ T cells (right panel). c Expression of CD20dim in infected and uninfected CD3+ T cells (left panel) and in the total CD3+ T cell population (right panel). d Correlation between the proportion of infected cells within the CD3+ T cell population and CD20 expression (left panel) and the mean fluorescence intensity (MFI) of CD20 (right panel). e Percentage of HLA-DR and PD-1 in infected and uninfected cells expressing or not expressing CD20dim. f Proportion of CD20dim in infected cells expressing the CD4 cell receptor versus infected cells with marked downregulation of the CD4 receptor. In all panels, the mean and SEM value of three independent experiments is represented. In panel (d), Spearman’s nonparametric correlation coefficients and associated p values are shown. Data underlying this Figure are provided as Source Data file

