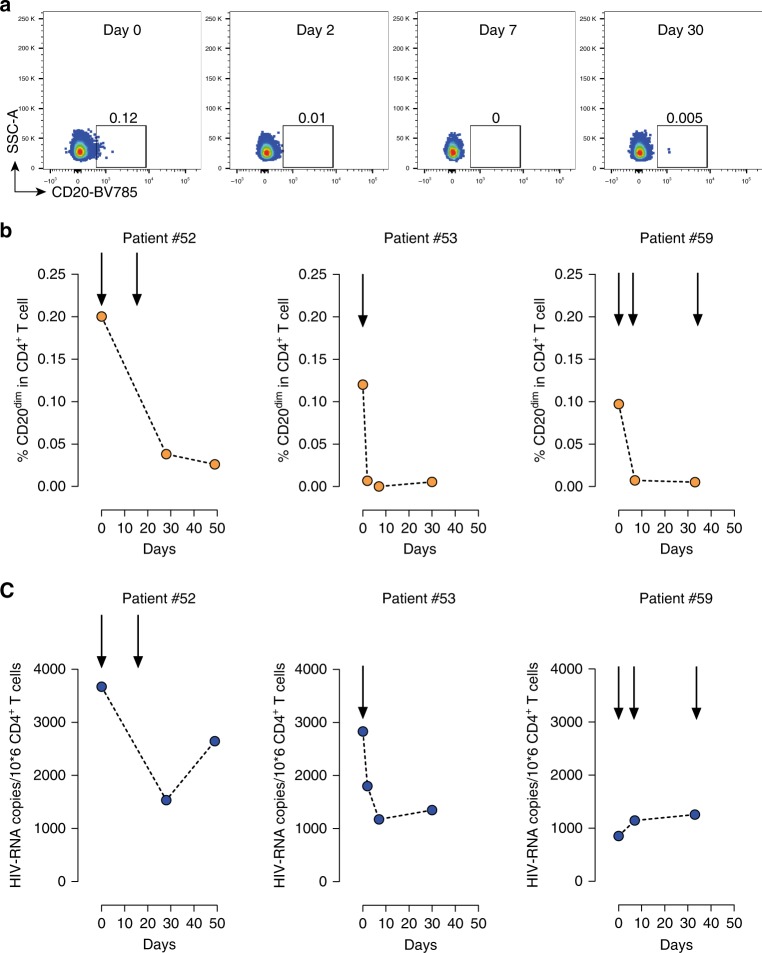
Fig. 7.
Effects of Rituximab treatment in CD20dim CD4+ T cells and intracellular HIV RNA. Three ART-suppressed patients were treated with Rituximab at indicated times (arrows) and blood samples were longitudinally collected. a Flow plots, following the same gating strategy as shown in Fig. 1a, of CD20 expression in CD4+ T cells in patient #53 are shown. b Frequencies of CD20dim CD4+ T cells in longitudinal samples from three patients are shown. c Copies of HIV RNA per million CD4+ T cells after Rituximab treatment. Individuals #52, #53, #59 are represented. Data underlying this Figure are provided as Source Data file

