Fig. 2.
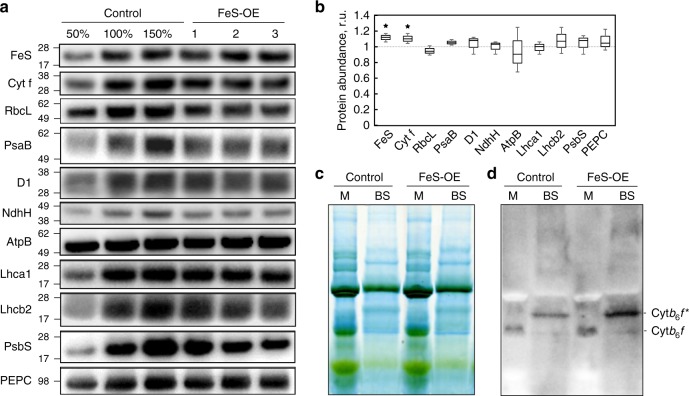
Relative abundance of photosynthetic proteins and Cytochrome b6f complex in plants with Rieske FeS overexpression (FeS-OE) and control plants. a Western blots with antibodies against Rieske FeS, Cyt f (Cytochrome f), RbcL (Rubisco large subunit), PsaB (Photosystem I), D1 (Photosystem II), NdhH (NDH complex), AtpB (ATP synthase), Lhca1 (light-harvesting complex of Photosystem I), Lhcb2 (light-harvesting complex of Photosystem II), PsbS (Photosystem II subunit S) and PEPC (PEP carboxylase). Positions of the molecular weight markers (kDa) are indicated on the left. b Quantification of protein abundances in FeS-OE plants on leaf area basis relative to control plants (=1). Mean ± SE, n = 3 biological replicates. Asterisks indicate statistically significant differences between transgenic and control plants (P < 0.05). c Blue Native gel electrophoresis of the thylakoid protein complexes isolated from mesophyll (M) and bundle sheath (BS) cells; 10 µg of chlorophyll (a+b) loaded in each lane. d Immunodetection of Cytochrome b6f complex from the Blue-Native gel with Rieske FeS antibodies; Cytb6f and Cytb6f*—two distinct forms of the complex detected. Zero(Null)-segregates were used as control plants. Uncropped images of the membranes used for immunodetection are available in Supplementary Fig. 6. Data points for the item b are available in Supplementary data 1

