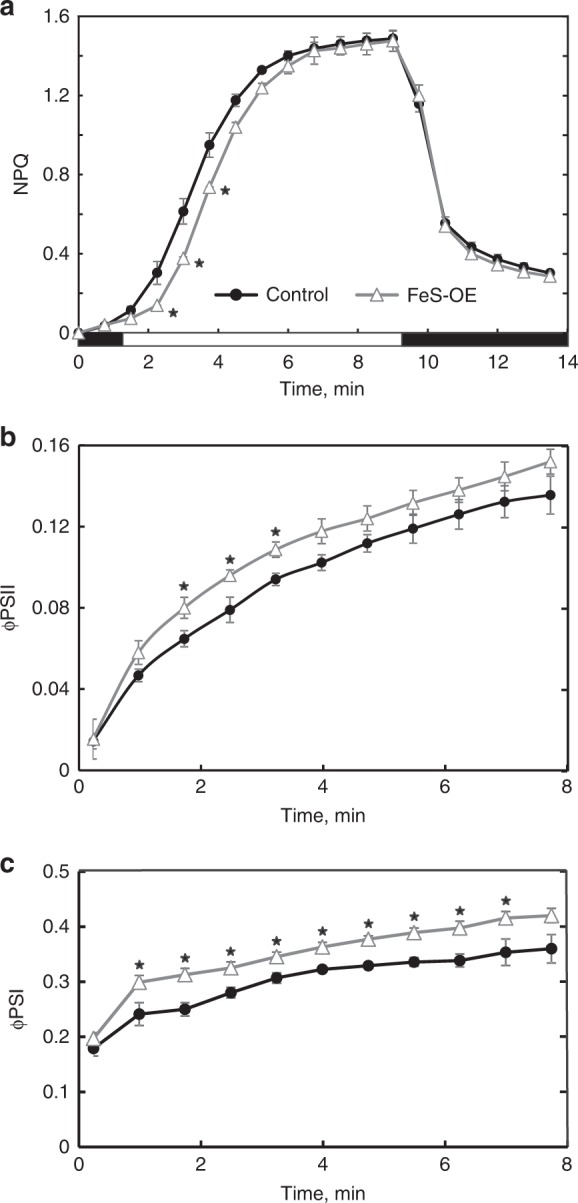
Fig. 6.

Photosynthetic parameters of plants with Rieske FeS overexpression (FeS-OE) and control plants during dark/light transitions measured on dark-adapted leaves. a Induction and relaxation of NPQ during dark-light-dark shift: black bars, darkness; white bar, red actinic light of 220 µmol m−2 s−1. b, c Dynamic changes of φPSII and φPSI, quantum yields of Photosystem II and Photosystem I, during first minutes of illumination with red actinic light of 220 µmol m−2 s−1. Results are for the T2 plants of the line 230(4)-7. Mean ± SE, n = 3 biological replicates. Asterisks indicate statistically significant differences between FeS-OE and control plants (P < 0.05). Zero(Null)-segregates were used as control plants. Data points are available in Supplementary data 5
