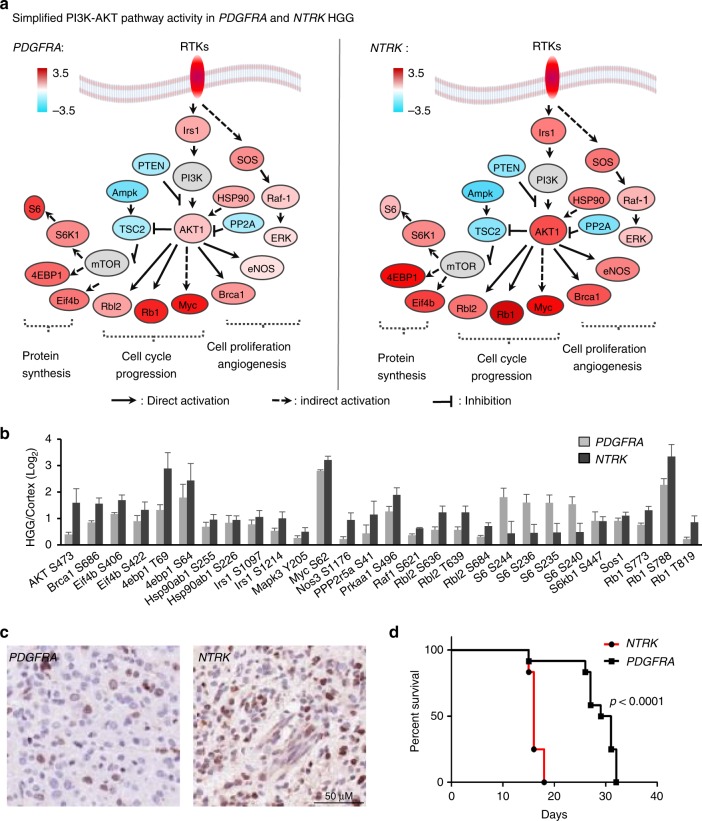
Fig. 6.
NTRK fusion is a stronger oncogenic driver than PDGFRA mutation in mouse HGG. a PI3K-AKT pathway is active in both PDGFRA-driven and NTRK-driven HGGs. Simplified PI3K-AKT pathway diagram shows activity change according to the phosphorylation of functional sites. Color key shows the Log2 fold change of phosphosites in PDGFRA- or NTRK-driven tumors compared to normal cortex. b NTRK-driven HGG displays stronger PI3K-AKT signaling activity than PDGFRA-driven HGG. MS-based measurements of phosphosites with activation or inhibition functions. Error bar indicates s.e.m. c NTRK-driven HGG shows higher cell proliferative index compared to PDGRA-driven HGG. Representative Ki-67 IHC-stained sections on PDGFRA- and NTRK-driven HGGs to examine the proliferative indexes of HGGs. A 50 µm scale bar is shown. d NTRK-driven HGG exhibits short tumor onset latency than PDGFRA-driven HGG. HGG K−M curve confirms more rapid mice tumor onset of NTRK-driven HGGs (n = 12) compared to PDGFRA-driven HGGs (n = 12). The p value was determined by Student’s t test. HGG high-grade glioma, MS mass spectrometry

