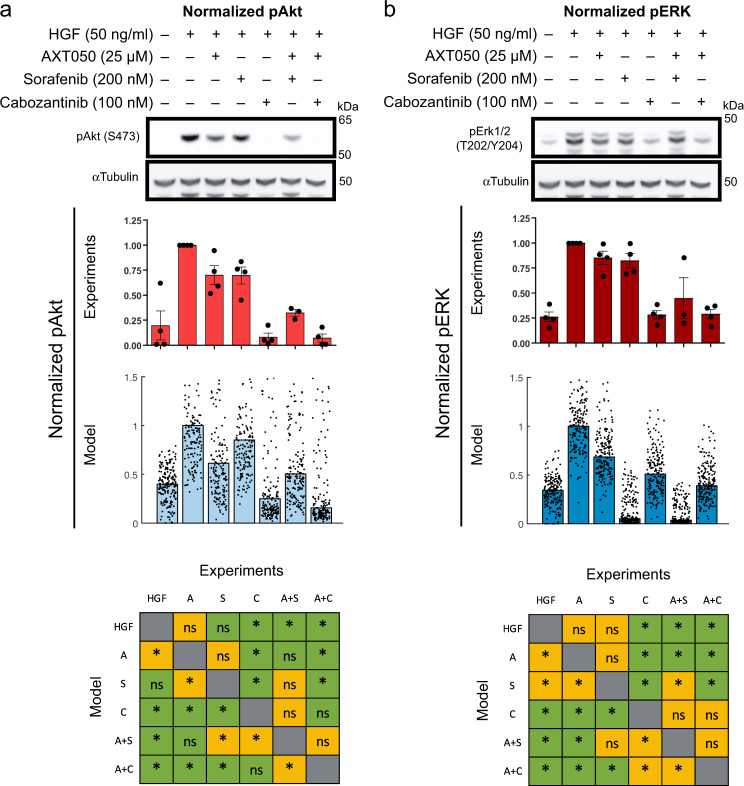
Fig. 3.
Experimental data and comparison with model. Phosphorylation of Akt (a) and ERK (extracellular-regulated kinase) (b) and were measured for hepatocyte growth factor (HGF) treatment along with AXT050, sorafenib and cabozantinib or AXT050 + sorafenib and AXT05 + cabozantinib. Cropped images of the western blots and the experimental data (blue) were normalized to HGF control for each gel and is shown as mean ± SEM (n = 4, except for AXT050 + sorafenib with n = 3). Uncropped images of the sample blots are available in the supplements (Supplementary Fig. 6). The modeling results are shown as median (bar graph) and the data points for all the Monte Carlo resampled cases. Experimental data were compared using analysis of variance with Tukey’s multiple comparisons correction, while non-parametric Kruskal–Wallis test with Bonferroni correction was used to compare modeled groups. Significance was assumed at corrected p < 0.05. Bottom row compares the significant changes between model and experiments

