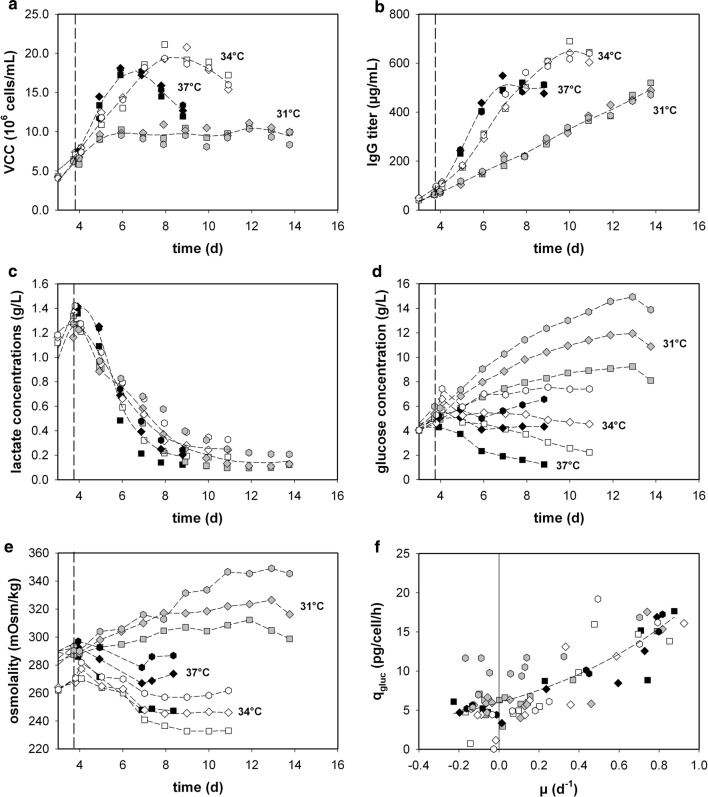
Fig. 2.
Fed-batch process parameters: a VCC, b protein titer, c lactate and d glucose concentration and e osmolality as a function of process time. f Specific glucose consumption (qgluc) as a function of the growth rate (µ). 37 °C + Feed 1 [filled square], 37 °C + Feed 2 [filled diamond], 37 °C + Feed 3 [filled hexagon], 34 °C + Feed 1 [unfilled square], 34 °C + Feed 2 [unfilled diamond], 34 °C + Feed 3 [unfilled hexagon], 31 °C + Feed 1 [grey square], 31 °C + Feed 2 [grey diamond], 31 °C + Feed 3 [grey hexagon]. Fed-batch process started at day 3. Vertical dashed line indicates temperature shift (≈ day 4). Short dashed lines indicate trends

