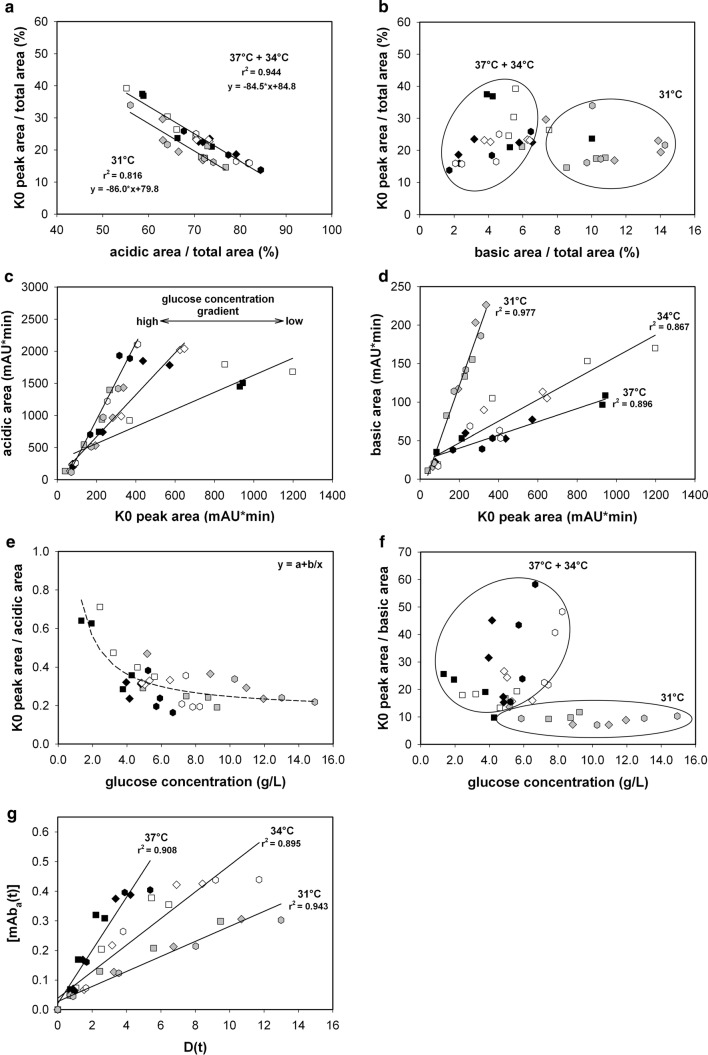
Fig. 3.
K0 main peak ratio as a function of the acidic (a) and basic variant (b) ratio. c Acidic area and d basic area as a function of the K0 main peak area. The ratio of the K0 peak area to the e acidic area and the f basic area as a function of glucose concentration. g Acidic peak area concentration at time point t as a function of D(t), that is, the product of newly built IgG concentration and glucose concentration integrated over time. 37 °C + Feed 1 [filled square], 37 °C + Feed 2 [filled diamond], 37 °C + Feed 3 [filled hexagon], 34 °C + Feed 1 [unfilled square], 34 °C + Feed 2 [unfilled diamond], 34 °C + Feed 3 [unfilled hexagon], 31 °C + Feed 1 [grey square], 31 °C + Feed 2 [grey diamond], 31 °C + Feed 3 [grey hexagon]

