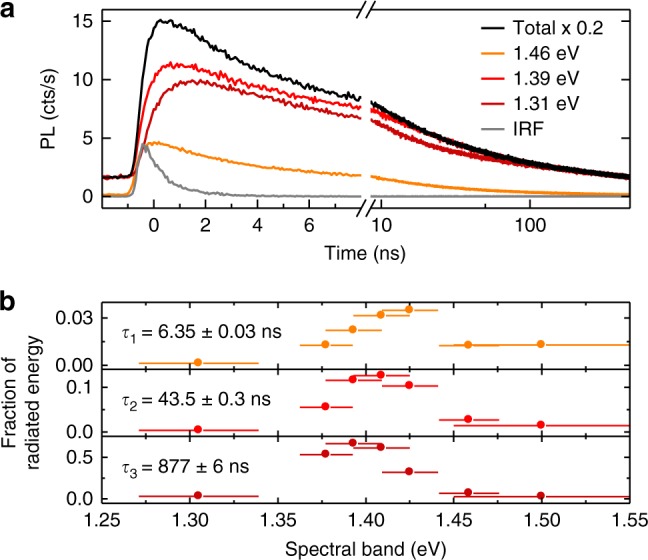
Fig. 2.

a Confocal PL decay measured in different spectral bands of the HBL peak in Fig. 1. Decay traces are shown in different colors for three spectral bands centered at 1.46, 1.39, and 1.31 eV together with the total decay trace in black (scaled by ×0.2) and the instrument response function (IRF) in gray. The decay of the total spectrally unfiltered PL was approximated best by three-exponential decay channels with time constants of ~6, 44, and 877 ns. b Relative contributions of the three decay channels in discrete spectral windows with central energies and widths represented by dots and bars, respectively. For each spectral window, the contributions were extracted from triple-exponential fits with decay constants fixed to the characteristic timescales of the total HBL emission
