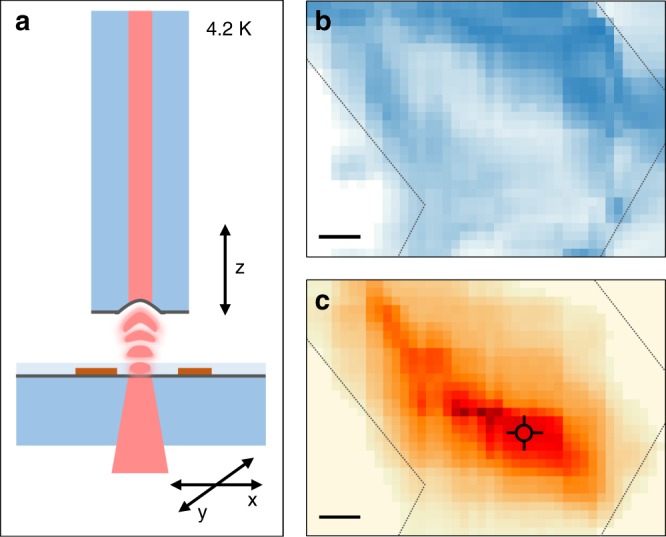
Fig. 3.

a Cavity setup at 4.2 K: the fiber-based micro-mirror forms the cavity together with a planar macro-mirror with CVD-grown MoSe2-WSe2 heterostructure on top. Independent translational degrees of freedom enable lateral sample displacement and cavity length detuning. b Transmission map recorded through the cavity with laser excitation at 635 nm (blue color corresponds to reduced transmission due to local variations in absorption and scattering). c Map of integrated PL intensity recorded simultaneously with the transmission map (dark red color represents maximum intensity). The cross indicates the position on the flake used in the measurements of Figs. 2 and 4, the gray dashed lines indicate the boundaries of the flake. The scale bar is 10 μm in both maps
