Fig. 3.
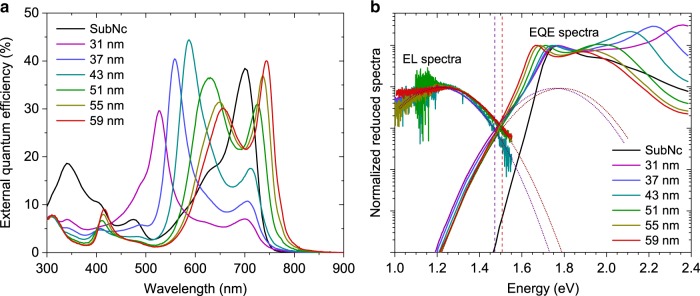
Effects of strong coupling on EQE and electroluminescence of SubNc/C60 based cells. a EQE spectra for strongly coupled SubNc/C60 solar cells, for varying transport layer thickness d. EQE of a reference solar cell utilizing only SubNc (‘SubNc’, black) is included for comparison. In the strongly coupled devices, the SubNc peak is split into two polariton peaks which redshift for increasing d. b Sensitively measured normalized reduced EQE and EL spectra of the same devices. The low-energy EQE and high-energy EL edges of the most blue-shifted and red-shifted spectra are fitted (purple and red dashed lines, respectively) and the crossing point of their Gaussian lineshapes (purple and red dotted lines) provide the CT-state energy in each case

