Fig. 4.
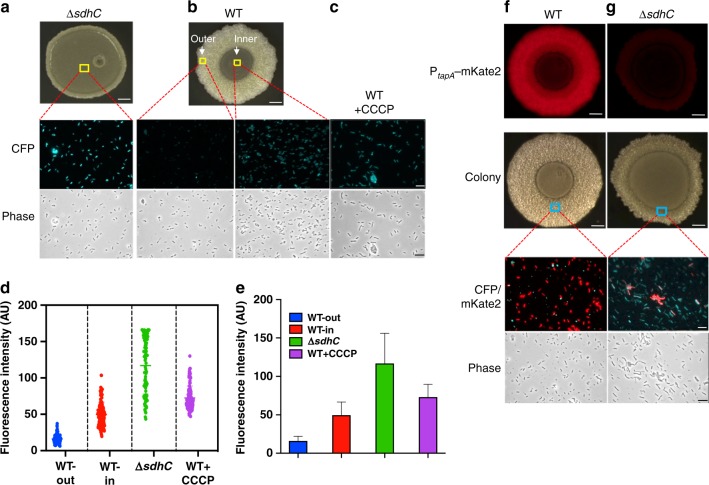
Membrane potential is key to biofilm matrix production. a Detection of the membrane potential in cells collected from the inner region of (indicated by the yellow square) a 2-day ΔsdhC biofilm colony by using the fluorescent dye thioflavin T (ThT, shown as cyan fluorescent protein (CFP)). The overall strong cyan fluorescence (CFP) signal of the ΔsdhC cells implies weak membrane potential of the cells since the dye accumulation anticorrelates with the membrane potential. b Detection of the membrane potential in cells collected from the inner or the outer region (indicated by yellow squares) of a 2-day wild-type biofilm colony by using the fluorescent dye ThT. c Detection of the membrane potential in wild-type cells from shaking culture treated with the membrane depolymerizing agent CCCP (1 mM) as a control41. d, e Distribution (d) and quantification (e) of average pixel density from the ThT fluorescence dye accumulation in the cells from the outer and inner regions of the wild-type colony biofilm, ΔsdhC colony biofilm, and from wild-type cells treated with CCCP. Data presented are the mean ± s.d. (n = cell number in each image). Error bars represent standard deviations. f, g Simultaneous detection of the matrix gene expression and membrane potential in cells collected from the wild-type (f) or the ΔsdhC mutant (g) colony biofilms. The fluorescence reporter PtapA-mKate2 was used to probe the expression of the matrix operon tapA-sipW-tasA. Membrane potential was probed by using the ThT dye (shown as CFP). Biofilm colonies with red fluorescence were recorded by using a dissecting fluorescent microscopy. Scale bars in all images showing biofilms, 5 mm. Scale bars in all microscopic images showing individual cells, 10 µm. Source data are provided as a Source data file

