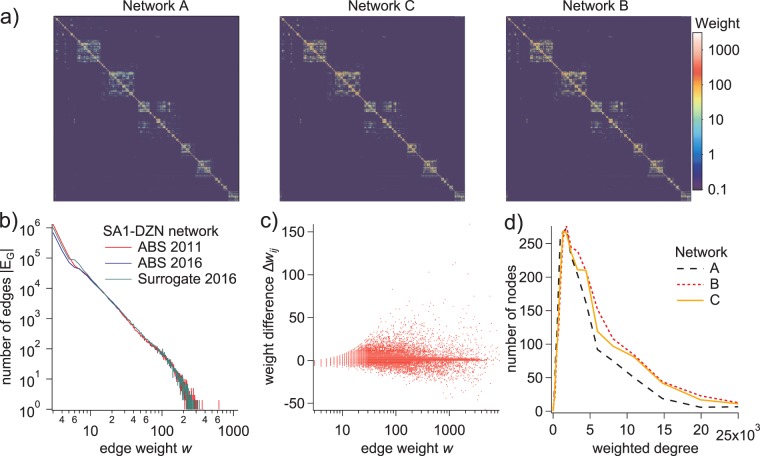
Fig. 6.
Validation of the surrogate network. (a) Color plots of the SA2 → SA2 adjacency matrix from the aggregate of the original SA1 → DZN network A, the aggregated surrogate C, and the ABS-provided SA2 → SA2 network B. The SA2 regions are somewhat spatially ordered such that the different states, in particular the larger urban areas, are clustered around the diagonal. (b) Weight distributions for the networks R, H and S. (c) Weight difference, Δwij, as a function of w(EAB, B), demonstrate improved quantitative agreement (compare to Fig. 3b). (d) Distributions of node degree strength (total incident edge weight) for networks A, B, and C.

