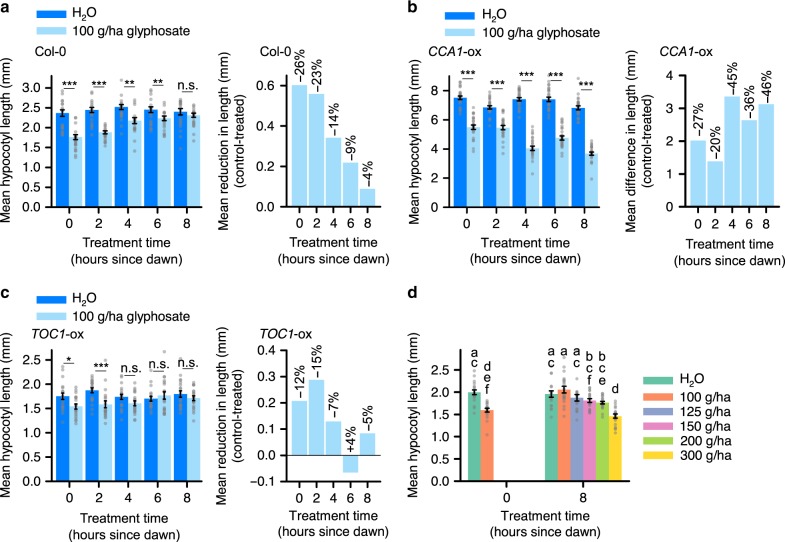
Fig. 1.
Daily rhythms in glyphosate effectiveness. a–c Under light/dark cycles, hypocotyls are shorter in seedlings treated with 100 g/ha glyphosate compared with controls at times specified, in a Col-0, b CCA1-ox and c TOC1-ox seedlings. Graphs show (left) hypocotyl length and (right) change in hypocotyl length caused by glyphosate. d Titration of glyphosate concentration required to cause equivalent decrease in hypocotyl length at dawn and dusk in the Col-0 background. a–d Significance determined by a–c two-way ANOVA and t-tests between control and treatment at each timepoint; d one-way ANOVA and Tukey post-hoc analysis. n.s. = not statistically significant, *P ≤ 0.05, **P ≤ 0.01, ***P ≤ 0.001. Data are mean ± s.e.m; n = 18–25. Source data are provided in the Source Data file

