Fig. 1.
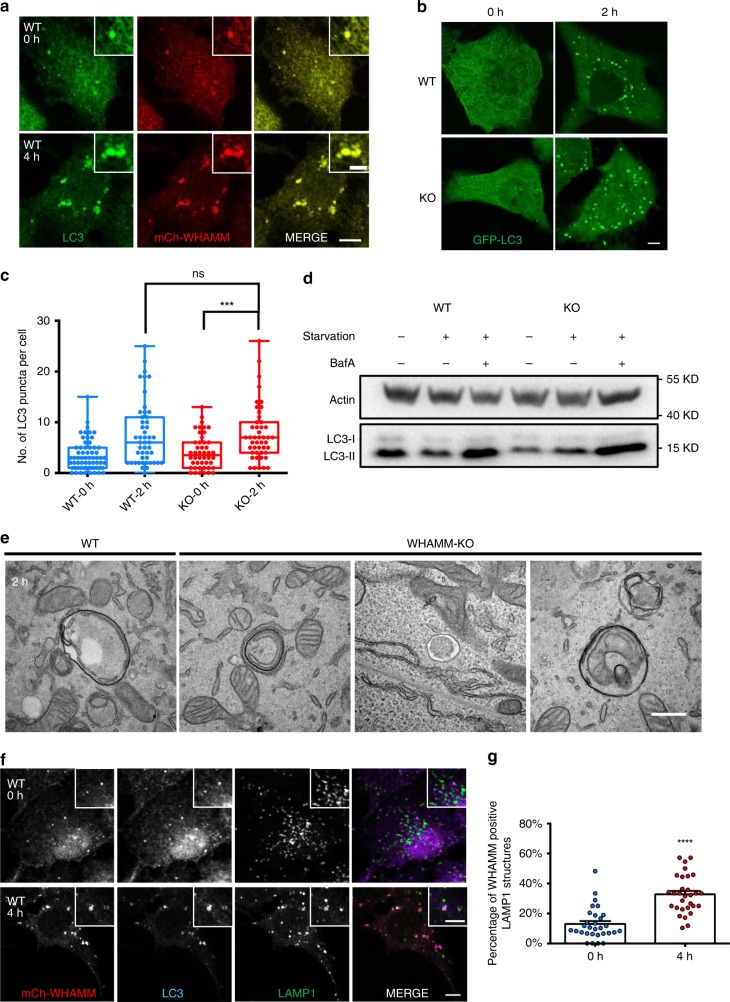
WHAMM knockout cells show normal levels of autophagosome maturation. a NRK cells stably expressing mCherry-WHAMM were starved for 0 or 4 h, then fixed and stained with antibodies against LC3 (scale bar, 5 μm). b CRISPR-Cas9-mediated gene knockout was used to generate a WHAMM knockout NRK cell line. Knockout verification and off-target analysis are shown in Supplementary Fig. 1. Both WT and WHAMM-KO cells stably expressing GFP-LC3 were starved for 2 h and observed using confocal microscopy (scale bar, 5 μm). c Cells in (b) were quantified for LC3 puncta. n = 65 (WT-0h), 46 (KO-0h), 48 (WT-2h), and 46 (KO-2h) cells were measured from two independent experiments. Box extends from 25th to 75th percentiles. Middle line indicates median. Whiskers represent min to max with all points shown. Two-tailed t test; ***p < 0.001; ns, not significant. d Autophagic flux was monitored by treating both WT and KO cells with Bafilomycin-A1 (BafA) after starvation. LC3 turnover was examined by western blot. e Representative TEM images of autophagosomes from both WT and KO cells after 2 h of starvation (scale bar, 500 nm). f NRK cells stably expressing mCherry-WHAMM were starved for 0 or 4 h, then fixed and stained with antibodies against LC3 and LAMP1 (scale bar, 5 μm). g Cells in f were measured for WHAMM-positive LAMP1 structures and quantified. n = 30 cells from two independent experiments. Error bars indicate SEM. Two-tailed t-test; ****p < 0.0001. Source data are provided as a Source Data file

