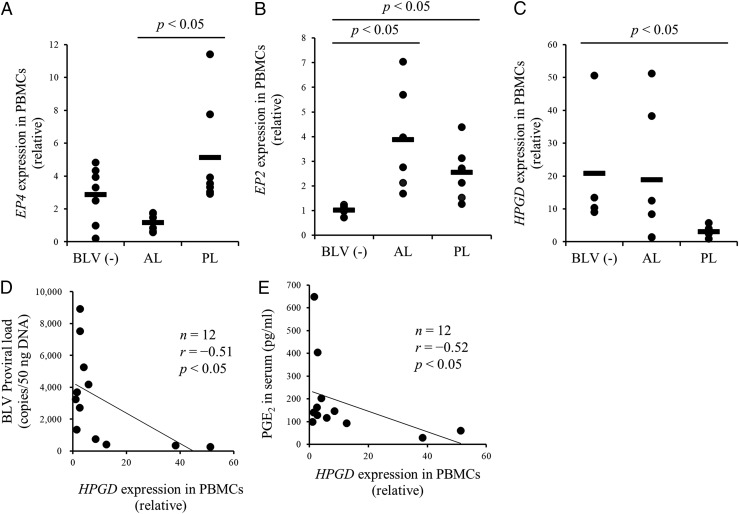
FIGURE 2.
Quantification of EP4, EP2, and HPGD mRNA expression in cattle infected with BLV. (A–C) Quantification of EP4 [BLV (−), n = 7; AL, n = 7; PL, n = 7), EP2 [BLV (−), n = 6; AL, n = 6; PL, n = 7), and HPGD [BLV (−), n = 4; AL, n = 6; PL, n = 6) mRNA expression in PBMCs of BLV-uninfected and BLV-infected cattle by qPCR. (D and E) Negative correlation between proviral load or the serum concentration of PGE2 and HPGD expression in PBMCs of cattle infected with BLV (n = 12). Each symbol represents relative expression level of each animal; pooled data from several experiments were analyzed by the Steel–Dwass test (A–C). Correlation statistic was analyzed using the Spearman correlation (D and E). BLV (−), BLV-uninfected cattle.

