Fig. 8.
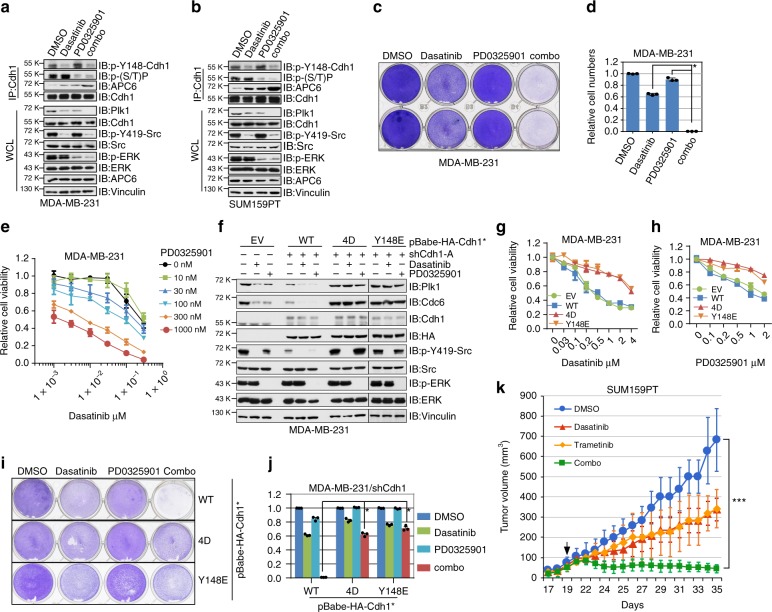
Src and MEK inhibitors synergistically suppress breast cancer cell survival. a, b N-terminal phosphorylation and protein levels of APCCdh1 ubiquitin substrates were reduced upon Src and/or MEK inhibition in MDA-MB-231 (a) and SUM159PT (b) cells. Immunoblot (IB) analysis of MDA-MB-231 (a) and SUM159PT (b) cells treated with either 100 nM Src inhibitor dasatinib, 100 nM MEK inhibitor PD0325901, a combination of these two inhibitors (combo), or DMSO as a negative control for 24 h before harvest. c, d Cells were treated with 300 nM dasatinib, 300 nM PD0325901, or the combination of dasatinib with PD0325901 for 3 days before being fixed and stained with crystal violet (c). Relative colony numbers were calculated as mean ± SD (n = 3). *P < 0.05; Student’s t test (d). e Dose–response curves of MDA-MB-231 cells treated with dasatinib, PD0325901 or the combination. Relative cell viability was determined after 72 h treatment. Combination indexes (CI) were calculated using the CompuSyn software as shown in Supplementary Fig. 8j. f IB analysis of EV-, WT-Cdh1-, 4D-Cdh1-, and Y148E-Cdh1-expressing MDA-MB-231 cells treated with either 300 nM dasatinib, 300 nM PD0325901, or DMSO as a negative control for 24 h before harvest. *Cdh1 cDNA used in this experiment has been mutated to escape shCdh1-mediated gene silencing. g, h Dose–response curves of EV-, WT-Cdh1-, 4D-Cdh1-, or Y148E-Cdh1-expressing MDA-MB-231 cells treated with dasatinib (g) and PD0325901 (h). Relative cell viability was determined after 72 h treatment. i, j WT-, 4D-, and Y148E-Cdh1-expressing MDA-MB-231 cells were treated with 300 nM dasatinib, 300 nM PD0325901, or the combination of dasatinib with PD0325901 for 3 days before being fixed and stained with crystal violet (i). Relative colony numbers were calculated as mean ± SD (n = 3). *P < 0.05; Student’s t test (j). k Growth curves of the SUM159PT xenograft tumors with the vehicle, dasatinib, trametinib or the combinational treatment started as the arrow indicates. In each flank of six nude mice, 3 × 10⁶ cells were injected. The tumor volumes were measured at the indicated days. Error bars represent ± SEM (n = 8). ***P < 0.001; Student’s t test

