Figure 4.
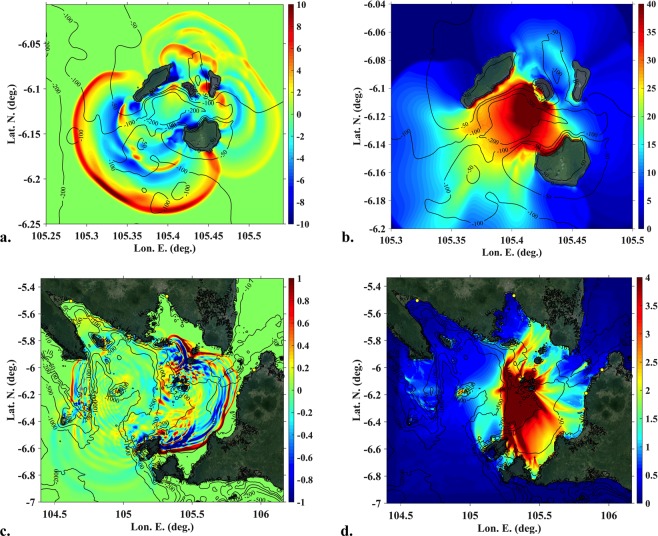
Tsunami surface elevations for AK collapse. (a,b) Instantaneous and maximum surface elevations (colour scale in meter), respectively, simulated with NHWAVE in grid G0, for the 0.27 km3 granular AK collapse at and up to 410 s; (c) Instantaneous surface elevation simulated with FUNWAVE-TVD at 1810 s in grid G1; (d) Envelope of NHWAVE/FUNWAVE- TVD SE up to 7,610 s. Reference level is MSL + 1.5 m (tide elevation in Marina Jambu45 at the time of tsunami arrival). Maps in (a–d) were produced by the authors based on the bathymetry/topography dataset, using MATLAB version 2017b; topography from GOOGLE EARTH georeferenced satellite images was embedded in these maps using an API key: GOOGLE EARTH, 2019 DigitalGlobe.

