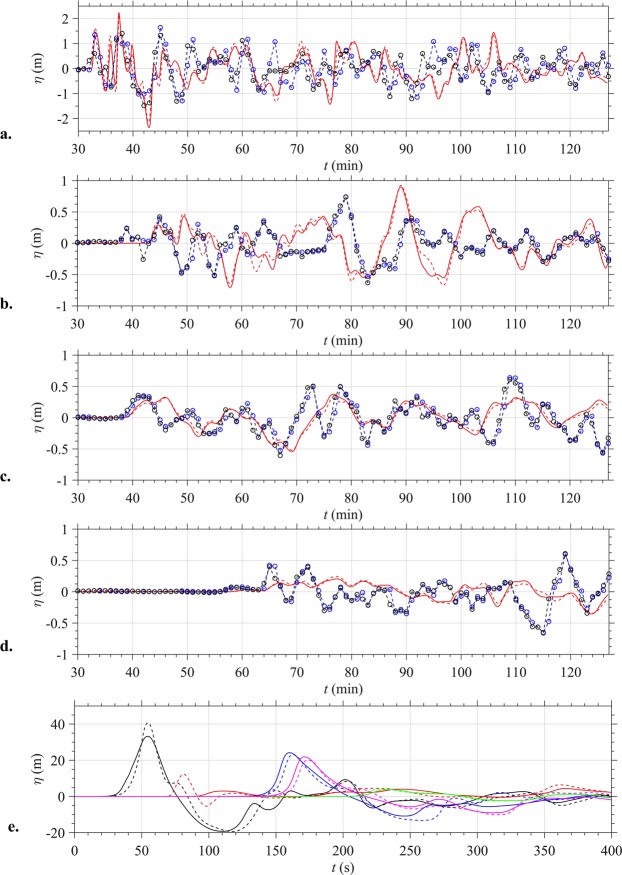
Figure 5.
Surface elevation time series at: (a–d) Tide Gauges 1–4 (TG; Table 1; Fig. 1a) computed with FUNWAVE in grid G1; symbols are detided observations using 2 different sensors45. (e) Numerical Wave Gauge 5–9 (WG; Table 1; Fig. 1b) computed with NHWAVE in grid G0: (black) 5, (blue) 6, (red) 7, (green) 8, (magenta) 9. Time t = 0 is estimated collapse time, 20:57′ local time (UTC + 7). Computations are for (solid) viscous slide, or (dashed) granular slide.

