Figure 4.
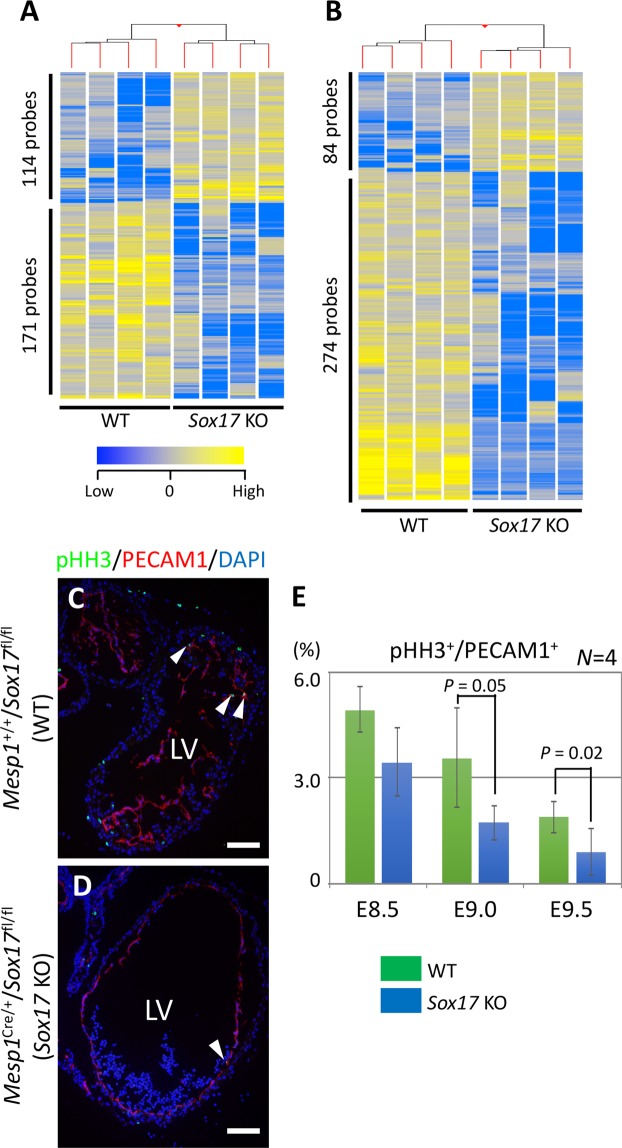
Altered gene expression profiles in the endocardium and myocardial cells of mesoderm-specific Sox17 mutant embryos. (A,B) Hierarchical clustering and heat map for 285 (A) and 358 (B) probe sets for differentially expressed genes in the endocardium and myocardial cells, respectively, of WT and Sox17 KO embryos at E8.5. (C,D) Immunofluorescence micrographs for pHH3 (green) and PECAM1 (red) in the heart of WT (C) and KO (D) embryos at E9.5. Blue is DAPI. Arrowheads indicate pHH3+ endocardium cells. LV, left ventricle; Scale bars, 50 µm. (E) Proportion of pHH3+ cells among PECAM1+ cells in the heart of WT and Sox17 KO embryos from E8.5 to E9.5. Means ± SD. Only P values of ≤0.05 (Student’s t test) are indicated.

